AMD Updates its 25x20 Goal: Progress in a Generation
by Ian Cutress on September 5, 2018 9:05 AM EST
Last year we published an article detailing AMD’s progress on its self-set 25x20 goal for its processors: 25x more energy efficiency of its chips by the year 2020. In our Raven Ridge APU analysis, AMD detailed the metrics it uses to measure its success in that goal. Recently AMD updated its graphs showing that improvements in this year's devices with Raven Ridge has pushed it closer to its goal. We recap how AMD tests and what these new numbers are.
Raven Ridge 2018: Same Silicon, Better System
First, let us discuss AMD’s latest announcements. During Hot Chips in August, AMD released a new update to its 25x20 goal, showing that while moving from 2017 to 2018, they have kept the same hardware but improved efficiency. Sounds too good to be true, right?
This is the graph in question.
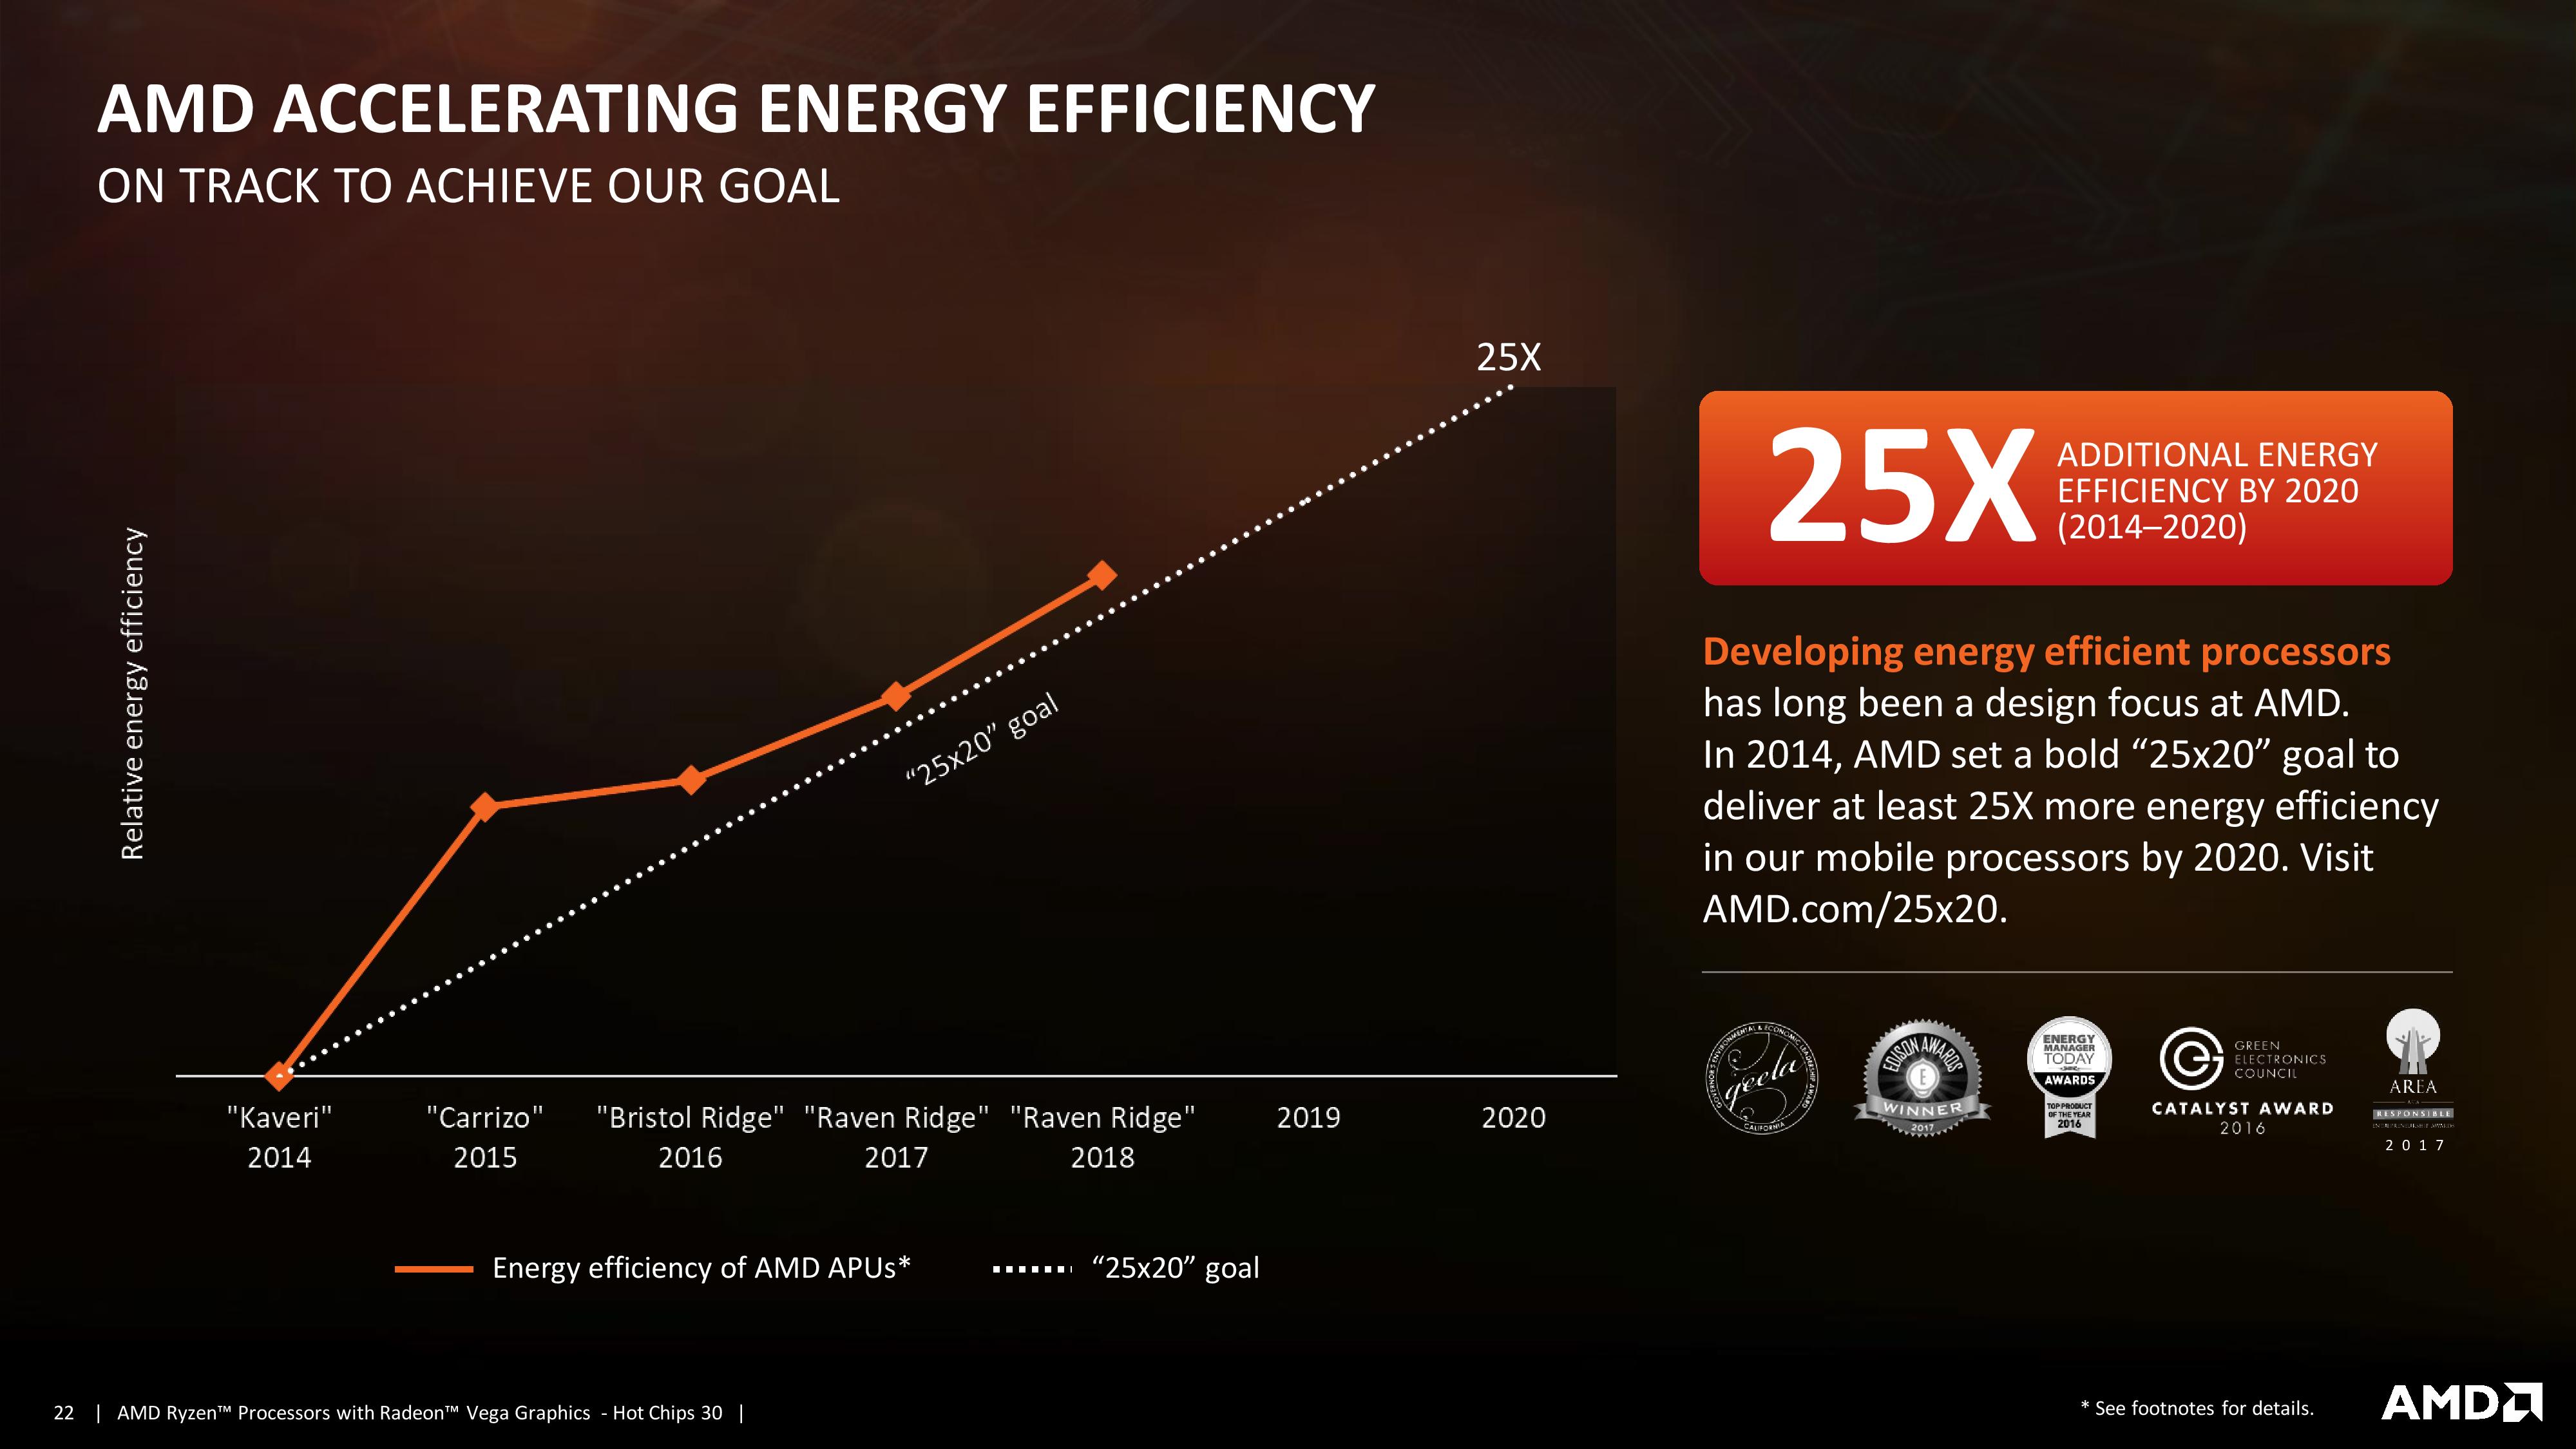
The base value for AMD’s goal is on its Kaveri mobile processors, which by the standards of today set a very low bar. As AMD moved to Carrizo, it implemented new power monitoring features on chip that allowed the system to offer a better distribution of power and ran closer to the true voltage needed, not wasting power. After Carrizo came Bristol Ridge, still based on the older cores, but used a new DDR4 controller as well as lower powered processors that were better optimized for efficiency.
A big leap came with Raven Ridge, with AMD combining its new highly efficient Zen x86 cores and Vega integrated graphics. This heralded a vast improvement in performance due to doubling the cores and improving the graphics, all within a similar power window as Bristol Ridge. This boosted up the important 25x20 metric and keeping it well above the ‘linear’ gain.
That was in 2017, and now in 2018 AMD is not a launching any new optimized mobile processor architectural designs, so how come Raven Ridge gets a significant boost? There are two ways.
When we talk about processor efficiency, binning the processor for the best voltage/frequency response is one way to optimize everything in one go. By choosing the best version of the silicon you can find, performance is higher, power is lower, and efficiency goes up. Because different processors can perform differently, a good binning process is required – as well as having sufficient volume to make it a retail product. As companies like AMD and the foundries understand manufacturing process, tweaks are often made to improve performance and reduce power – at the extreme this could mean optimizing one wafer for a single die. I mean, they could if they wanted.
The second is in the way how AMD calculates its 25x20 goal value. Here’s a recap of what we published last time around.
Calculating X: Get Me Some X Factor
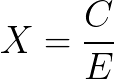
AMD calls the value it calculates as X, defined as the ratio between a performance metric C and an efficiency metric E. In 2017, it gave detailed notes on how it calculates these values:
- Overall performance efficiency X is C divided by E
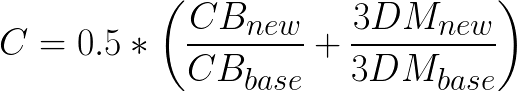
- Performance C is a 50:50 average pf CPU and GPU performance compared to Kaveri
- CPU Performance from Cinebench R15 nT Score
- GPU Performance from 3DMark 11 P Score - Energy Use E is defined by ETEC 'Typical Energy Consumption from Notebooks' as per Energy Star Program Requirements, Rev 6.1 Oct-2014
- Kaveri is the baseline where X = 1
The secret sauce is based on how you calculate C and E. The headline equation is as stated above:
The compute metric C is relatively easy to understand. Here AMD takes the 50-50 weighted average of CPU and GPU performance with the Cinebench R15 multi-threaded test and 3D Mark 11 P full benchmark.
Using Kaveri as a base result of 1.0, Carrizo scores 1.23, Bristol Ridge scores 1.36, and Raven Ridge 2017 scored 2.47. AMD hasn’t given scores for Raven Ridge 2018, however we analyze that below.
The efficiency metric E is vastly more complicated. It relies on a ‘typical energy use’ model defined by ETEC Energy Star program that adds weights based on sleep power, idle power, and some loading power. The equation looks a little like this:

The PT(x) options are the power consumed in those modes. The main thing to bring up about this metric is that it ends up being highly dependent on the device or laptop the processor is being used in. If you want the best result, you need a device that has a low powered, preferably low resolution but efficient display, a small efficient SSD, as few controllers as possible, and as much thermal headroom as possible. The best environment becomes this odd hybrid of premium components but low specifications.
For this metric AMD uses their internal reference platform, which is often based on one of the first devices to launch with the new product. This is where we initially believe that AMD’s improvements kick in – the first devices in 2017 with Raven Ridge were, not to sugar coat it, rather middle-of-the-road. As reported by our sister website Laptop Mag, the HP Envy x360 with Raven Ridge was a repurposed chassis from HP’s catalogue, rather than something hyper optimized. It is likely that AMD’s reference design mirrors this unit a lot, as AMD and HP work very close together. But clearly room for some improvement, which is where we think this ‘Raven Ridge 2018’ metric comes in to play.
For those keeping track, again the base line for this value is referred back to Kaveri. Kaveri also sets a low bar here, being a 19W TDP processor to begin with, and Carrizo improved the metric a lot through its much more optimized power monitoring and delivery. The goal here is for a lower value, so while Kaveri scored 1.00, Carrizo was 0.35, Bristol Ridge was 0.34, and Raven Ridge was up to 0.44, but gave almost double the performance of Bristol Ridge. As always, these values are often trade-offs, so efficiency becomes an important metric.
So What is Raven Ridge 2018 Then?
In AMD’s materials, the results and specifications of this new chip are not listed. Our sister website Tom’s Hardware believes that the new numbers are based on an upcoming processor such as the Ryzen 7 2800H, which was accidentally disclosed in a to-be-announced HP-based AMD device. If this is true, then AMD has likely gone for both better binning and a better notebook for their values. It is well within the realm of possibility, although not anything we can confirm.
What we can do is interpolate AMD’s graphical results. We have all the values, so let’s do the math.

So interestingly enough, AMD’s lack of y-axis is a little bit of an obfuscation. This graph is actually a logarithmic graph, with that straight line actually a bit of an exponential curve. This is because the normal linear graph doesn’t look too great. So we have to read off a logarithmic graph to get the values. We came up with this graph:
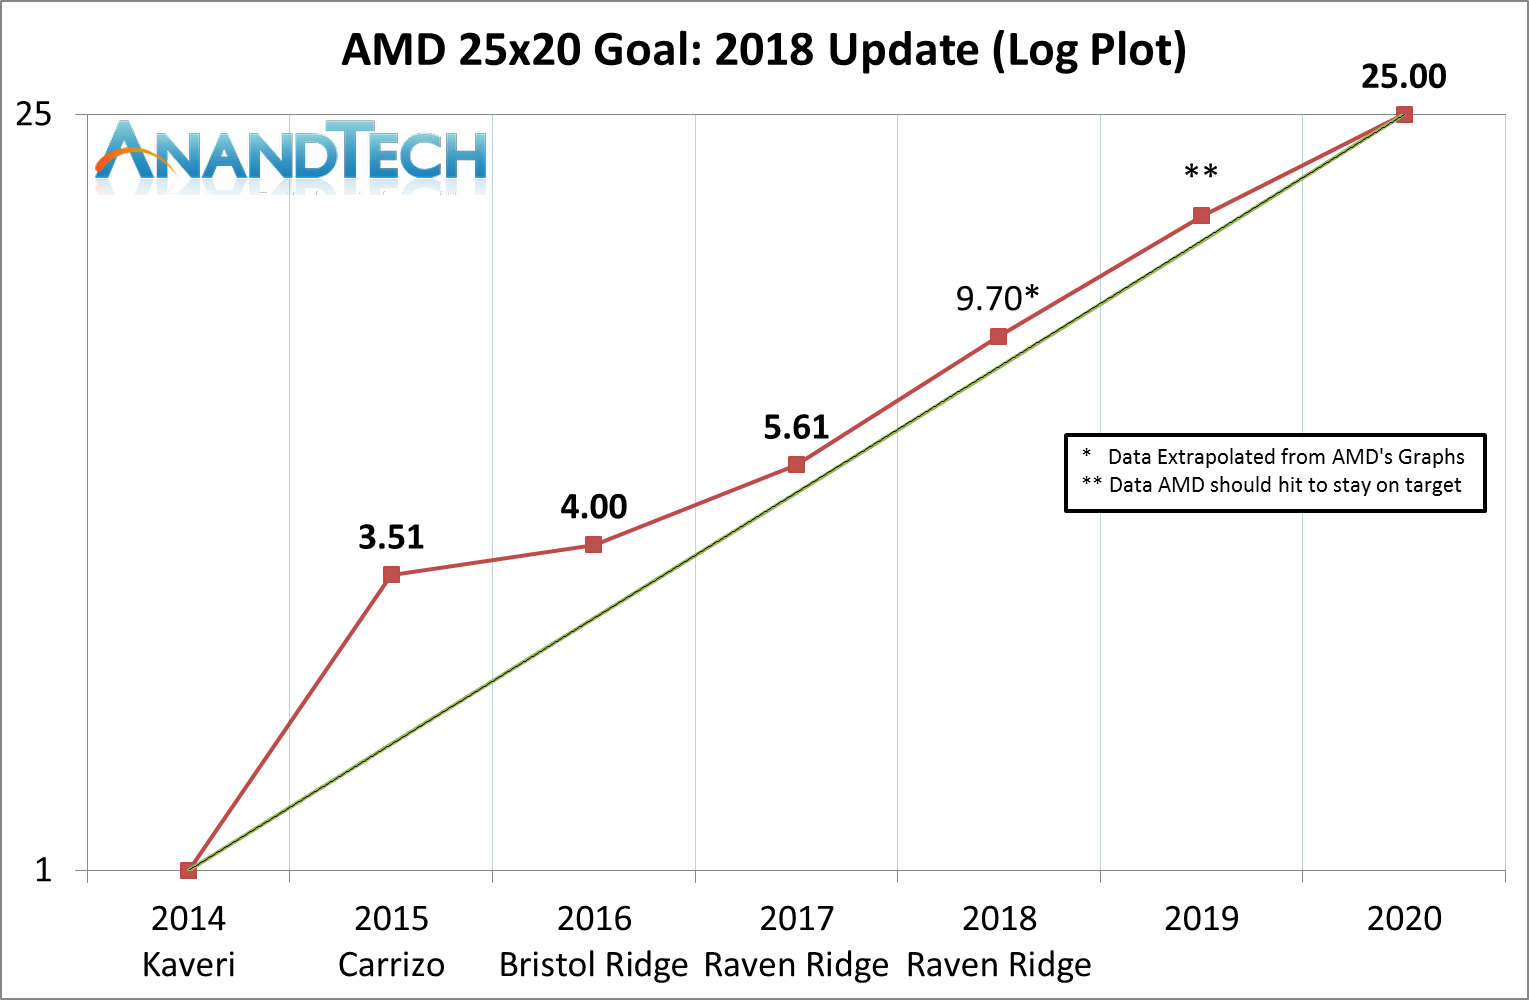
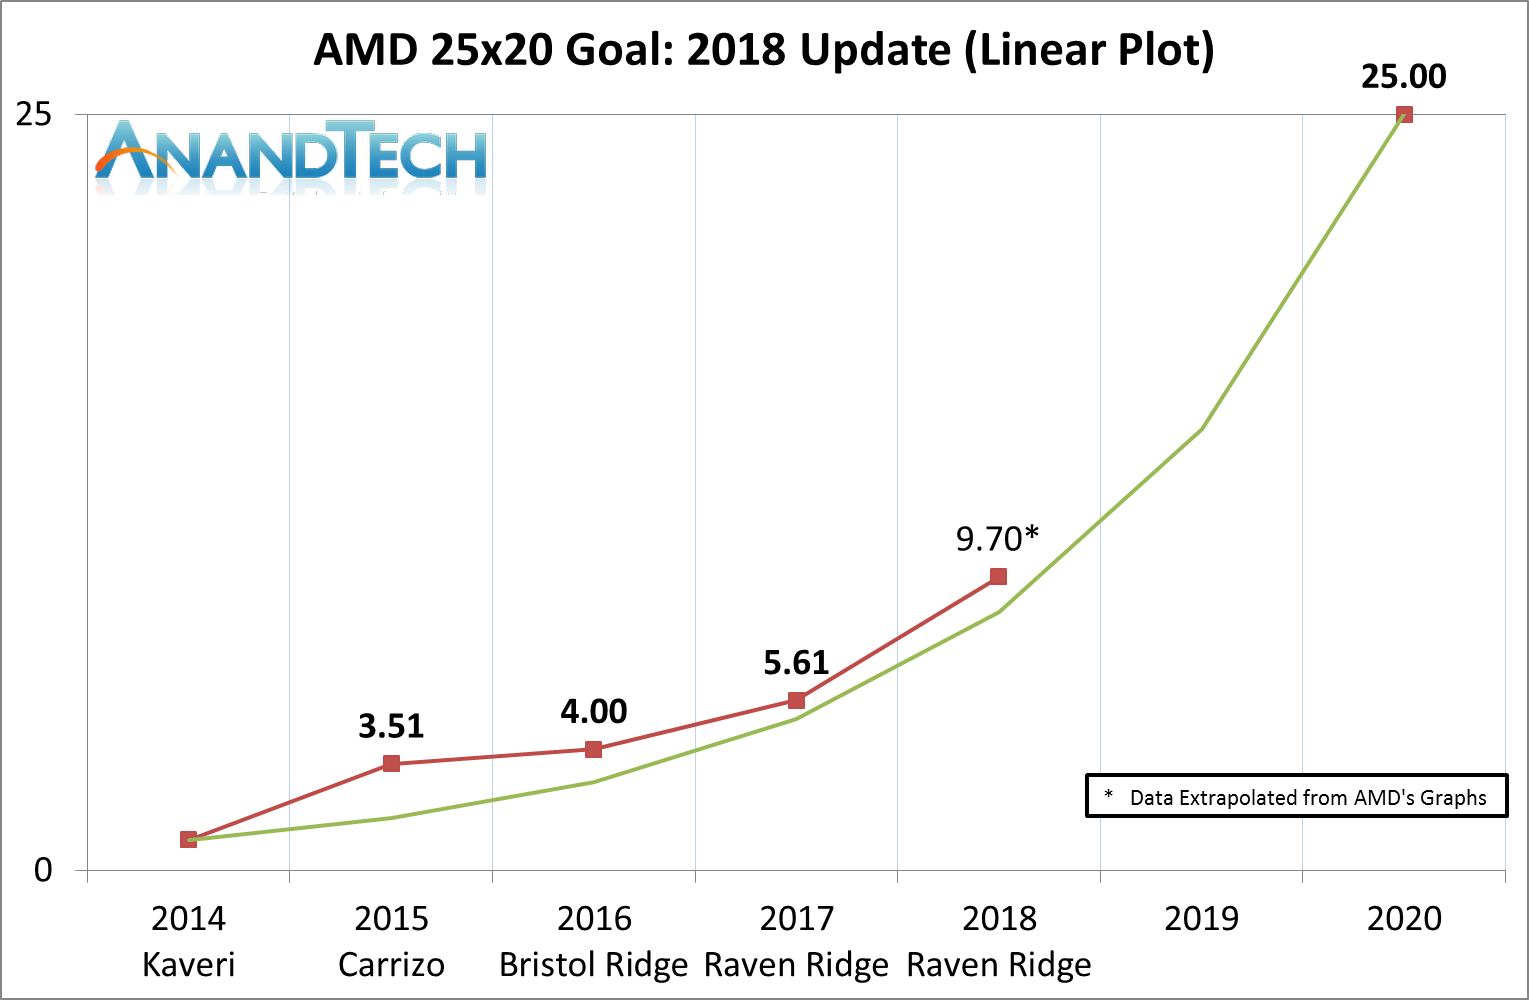
On the logarithmic graph, the job looks almost done. The non-log plot looks like the task is not even half done:
For anyone wondering, the equation for the ‘goal’ line approximates to:

Reading off of AMD's original graph, and noting that the Raven Ridge 2018 is a few pixels more above the log-plot line than the Raven Ridge 2017 value, we get an X of around 9.7.
Now we can put it all into a single table
| AMD's 25x20 Goal: Progress | ||||||
| AnandTech | Cinebench R15 nT |
3DMark 11 P | Compute (C) |
Energy (E) |
Performance Efficiency (X) |
|
| ? | 2020 | ? | ? | ? | ? | 25.00x |
| ? | 2019 | ? | ? | ? | ? | (16.20x)** |
| Raven Ridge | 2018 | ? | ? | ? | ? | 9.70x* |
| Raven Ridge | 2017 | 677 | 4425 | 2.47 | 0.44 | 5.61x*** |
| Bristol Ridge | 2016 | 279 | 3234 | 1.36 | 0.34 | 3.97x |
| Carrizo | 2015 | 277 | 2709 | 1.23 | 0.35 | 3.51x |
| Kaveri | 2014 | 232 | 2142 | 1.00 | 1.00 | 1.00x |
| * Data Interpolated from AMD's Graph ** Value AMD should hit on current trajectory *** Lower than originally disclosed in 2017, see below |
||||||
The value of X jumping up from 5.61 in Raven Ridge 2017 to 9.70 in Raven Ridge 2018 is a very large jump, even though it does not look like much on the graph. It corresponds to a rise of 72%, which would mean that either performance has increased 72%, or the power efficiency of the device being used has improved by 72%.
As AMD has not officially given values for C, E, or X yet, we can play around with various values to score what AMD has listed on its own graph. However, because the way the number is calculated, we can make some observations.
*** When we first published about Raven Ridge 2017 last year, AMD gave it a value of 5.86x, using a Cinebench score of 719 and 3DM11P of 4315, which made C = 2.56, but the same value of E, so 2.56C/0.44E = 5.86X. We've reached out to AMD as to why they are now using lower scores for this part.
In 2018, Raven Ridge Designs Have Been Optimized
The jump from Bristol Ridge to Raven Ridge, even with the sizeable jump in Cinebench and 3DM11 results, was not that great for a new generation of parts: from 3.97x to 5.66x. For a system that offered two more physical cores and a sizeable graphics boost, it was let down by the fact that the metric for E, the denominator in the equation, increased by around 30%. In an equation with a large numerator and small denominator, minor changes in that denominator can cause large swings in data.
Because E is based on off/sleep/idle power, that’s a lot of extra power being wasted in low power states. This is what an optimized system can take advantage of: better controls for disabling parts of the system that consume power in these low power states. Ideally complete power gating is needed, and given that Raven Ridge was AMD’s latest attempt with a new microarchitecture to go into premium notebooks, OEMs would have taken some serious time and effort to optimize these low power states and maximize both battery life and performance.
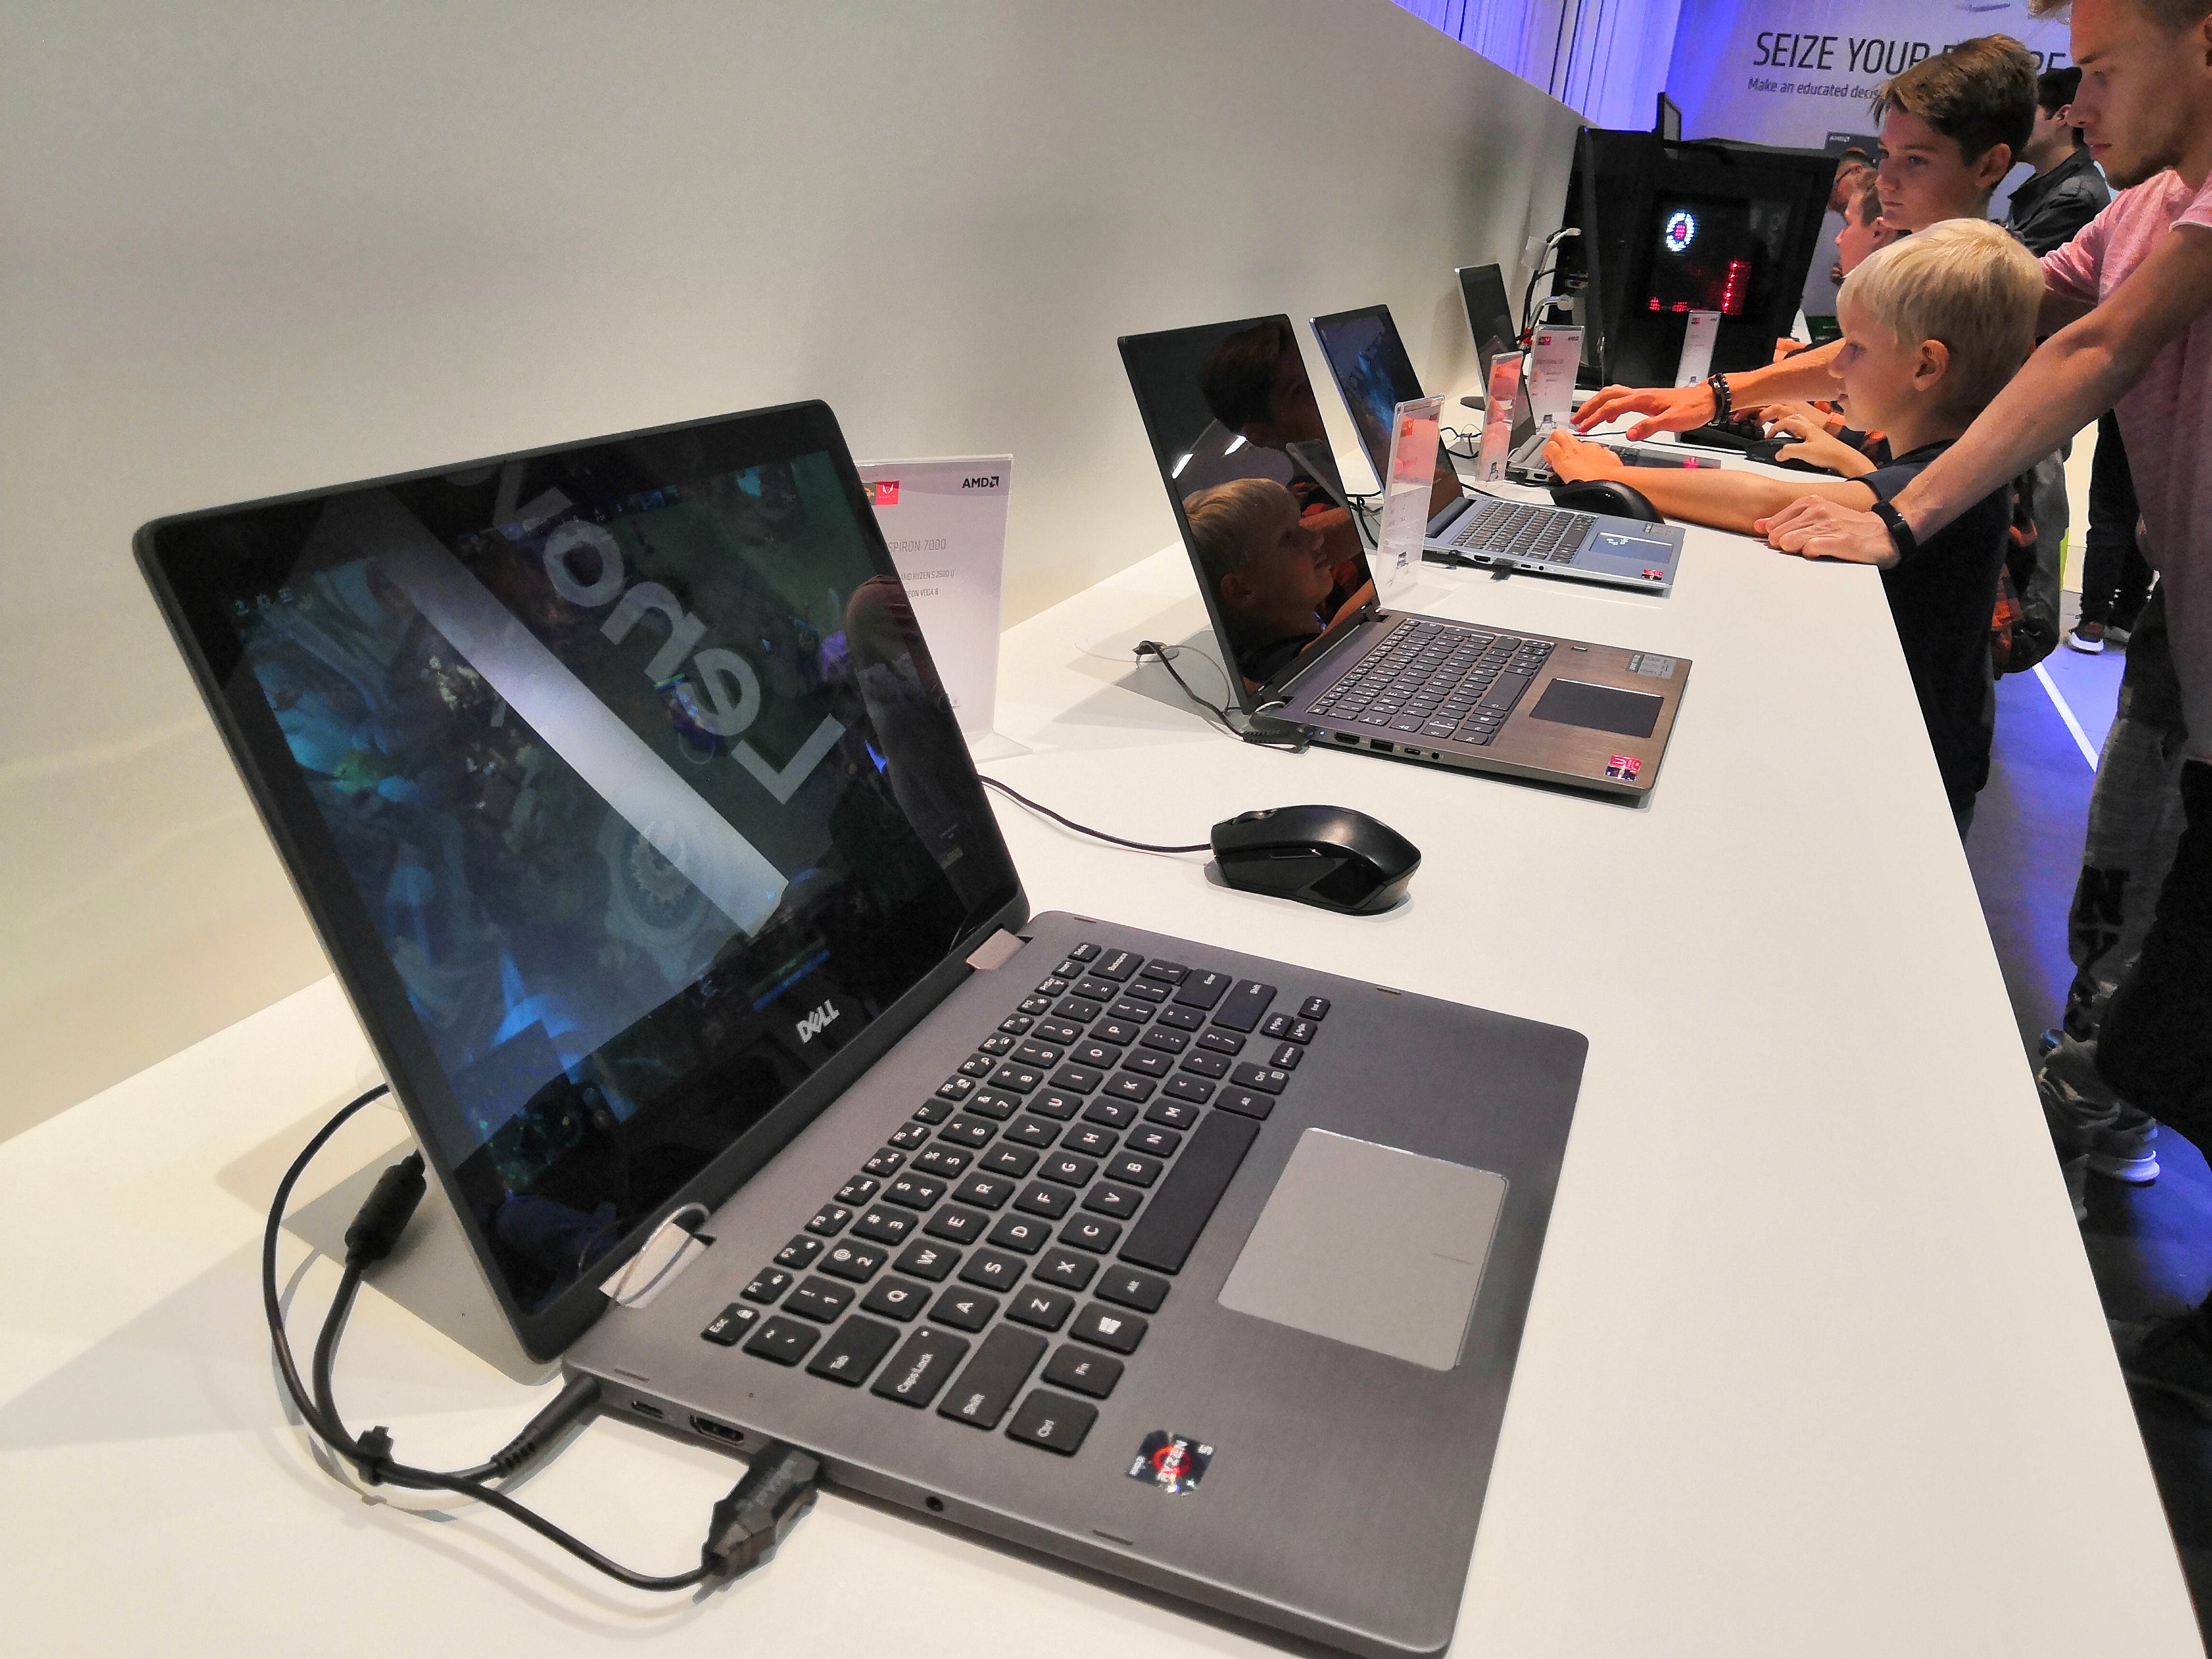
Raven Ridge-based Notebooks at IFA 2018
There’s also the added effect of using new APUs, such as the un-announced Ryzen 7 2800H as mentioned above. This has been listed by HP as a 35-54W processor, which is essentially 45W with configurable TDP. Mobile processors are the king of being optimized for idle and sleep power states, so it would not be farfetched to consider that an OEM has optimized both for the chip as they have learned about what it can do as well as given a decent power headroom performance. Add in some good chip binning, and it is fairly simple to see where gains have come from.
The question is all about how much does each change affect the overall score? Moving to a higher powered processor, but with the same CPU/GPU count will account for some 20-30% higher value in the C metric, and if the OEM can claw back that 30% in the lower sleep/idle power states, then put together it would account to close to the 72% value we calculated above.
Adding 30% to C raises the value from 2.47C in RR-2017 to 3.21C in RR-2018. Decreasing power down from 0.44E to 0.33E for a 33% drop means that 3.21C/0.33E = 9.73X.
| AMD's 25x20 Goal: Raven Ridge 2018 | ||||||
| AnandTech | Cinebench R15 nT |
3DMark 11 P | Compute (C) |
Energy (E) |
Performance Efficiency (X) |
|
| Raven Ridge | 2018 | - | - | 3.21** | 0.33** | 9.73x* |
| Raven Ridge | 2017 | 677 | 4425 | 2.47 | 0.44 | 5.61x |
| * Data Interpolated from AMD's Graph ** Data predicted that fits with value of X |
||||||
If we wanted to go in deeper, we’d look to see how the changes would adjust at the Cinebench and 3DM11.
What’s Next for 25x20
We are still two years away from AMD’s self-imposed limit on this goal. Last year, we suggested three ways in which AMD could achieve this goal - a 'same power' goal, a 'half-power' goal, and a 'low-power' goal.
Ryan went the low power route, and suggested that AMD would have to look at a 5W-esque processor in order to get to 25x, which would drop the value of E significantly while keeping the performance of RR-2017. I suggested it would require a bit more performance and power saving. Assuming my numbers are correct for RR-2018, AMD would need to improve performance another 25%, but reduce idle power by half at the same time. Ultimately it would appear that AMD is hoping that next generation 7nm brings either good amount of performance uplift, or idle power is reduced dramatically.
| AMD's 25x20 Goal: Future? | ||||||
| AnandTech | Cinebench R15 nT |
3DMark 11 P | Variable C | Variable E | Performance Efficiency |
|
| Same Power | 2020 | 2000 | 18000 | 8.51 | 0.34 | 25.04x |
| Half Power | 2020 | 1000 | 8000 | 4.02 | 0.16 | 25.14x |
| Low Power | 2020 | 800 | 4400 | 2.75 | 0.11 | 25.01x |
| Raven Ridge | 2018 | - | - | 3.21** | 0.33** | 9.73x* |
| Raven Ridge | 2017 | 677 | 4425 | 2.47 | 0.44 | 5.61x |
| Bristol Ridge | 2016 | 279 | 3234 | 1.36 | 0.34 | 3.97x |
| Carrizo | 2015 | 277 | 2709 | 1.23 | 0.35 | 3.51x |
| Kaveri | 2014 | 232 | 2142 | 1.00 | 1.00 | 1.00x |
| * Data Interpolated from AMD's Graph ** Data predicted that fits with value of X |
||||||
We know that AMD will migrate the APU line onto 7nm next year, which will also include Zen 2 cores. The question about what AMD might have for its APUs by the end of 2020 is a matter for debate, although updates on cores and GPUs are expected as well as process improvements.
We're waiting on AMD to release detailed numbers for its Raven Ridge 2018 system. When we requested them, AMD stated that they didn't have anything extra to announce beyond the graph at the top, but given that the values were listed as Raven Ridge 2018, we expect the data to come by the end of the year.
Related Reading


47 Comments
View All Comments
Santoval - Monday, September 10, 2018 - link
There will be no Vega 2, you rather mean Vega 20. If Navi is released in 2019 (it's possible that Sony wants a PS5-first release, so it might slip into 2020, though since PS5's Navi will be semi-custom that might not be an issue) it will not compete with Nvidia's high end graphics cards. At best it will compete with RTX 2070, minus the ray-tracing and DLSS, though it should be quite more power efficient and presumably cheaper*.Dual Navi was canned due to the game developers' reluctance to target multi-GPU cards (according to AMD), but they might release dual-Navi professional cards, since in that market multiple GPUs are a requirement rather than an issue.
*Nvidia's RTX series (or, at least, the top three cards of the series) looks like it is going to be a disaster, so all bets are off. If their consumer sales slump, as is expected, AMD might gain an opening with Navi and Nvidia might be forced to move to 7nm within ~6 months to get back on track.
MrCommunistGen - Wednesday, September 5, 2018 - link
I feel like moving the next gen chipset to something a bit smaller than 55nm might help with platform power. Maybe something like the GF 28nm bulk process they've used in the past for inexpensive parts. This would probably help reduce power and hopefully keep manufacturing costs low, minus the dev costs of taping out a new chipset at a new node.I know there's a tradeoff between surface area (specifically perimeter) vs I/O, but I'd expect that this should at least be theoretically possible since Intel manufactures the 1151 chipsets at 22nm and the 100/200/300 series chipsets offer more I/O than AMD's chipsets.
Of course the part of this I'm pretty ignorant about is how this would impact the overall platform. I feel like this could break backwards compatibility, at least with existing board designs, if not with the existing batch of CPUs. Since that seems to be what people think will happen with the switch to PCI-E 4.0, maybe we won't see a smaller chipset until then.
Trixanity - Wednesday, September 5, 2018 - link
With the exception of Z370 (which is 22nm), the 300 series chipsets are actually 14nm.lightningz71 - Wednesday, September 5, 2018 - link
GF 12nm offers modest power/performance improvements over GF 14nm. Just by moving RR to Picasso 12nm, if they keep their frequency scaling modest, they can realize non-trivial power/performance savings and stay at least somewhat on the scale until 7nm APUs arrive. The same can be applied to their chipsets as they are largely on 14nm at the moment. As it still looks like AMD will have production comittments at GF in the near term, using the 12nm node as much as possible makes the most sense for them.WatcherCK - Wednesday, September 5, 2018 - link
With a shrink to 7nm would Zen 2 get a core jump? 6 core (maybe even at 4GHz all core) plus some more compute cores for around $250 US?GreenReaper - Wednesday, September 5, 2018 - link
It's tricky. Is the goal best peak single-threaded performance? If so, quad-core will likely be a better bet. Or do they want improved idle power (being able to shut off more of the area if there are only a few threads running) and perhaps increased multi-core performance? If so, six core may be it.It's partly a bet on the software ecosystem. Browsers have come a long way, many games and CPU-heavy graphics operations were still there, but other software is still catching up. Still, if you're stuck looking for ways to improve a single-threaded task in 2018 it's an obvious win to find some way to parallelize it. And if nothing else we all have "more" running in the background nowadays.
My bet would be on the six-core design and relying on binning or disabling cores to cut it down to four, letting them run at a higher power to make up. It's clear RR cores *can* use lots of energy, and they'll probably have to turn them down for most use-cases, just as we've seen with Huawei's mobile CPUs.
How they arrange six cores might be interesting - a hexagon around the L2 cache? Would be pretty, but probably not feasible. ^_^
RSAUser - Friday, September 7, 2018 - link
Considering how Zen cores are packaged, they'll probably just create it so there's e.g. 2x4 compounds and just turbo the one compound for single threaded performance while putting the unneeded ones into low power or sleep state, allowing the high performance compound to perform well.Due to the design, you could maybe make it do that each CPU gets one compound that clocks really high for single threaded and use a preferred core system that's set at manufacturing.
I hope Zen2 lives up to expectations, I'm due an upgrade at work and need the multithread capabilities, though the 2700 already looks pretty good.
iwod - Thursday, September 6, 2018 - link
Current Rumours suggest AMD going all in, and doing double the core count with 7nm, i.e going up to 64 Core. ( And I hope they charge a premium for it, )I am not sure if they will do more core for same price, given 7nm is an expensive node. But if Zen 2 could do higher frequency and higher IPC, they could sell the same core count for same price and you still get 10 - 20% improvement.
Mil0 - Monday, September 17, 2018 - link
This is it, IMO. 2018 numbers lead to 880 cinebench score. So all they need to do for 2020 is double the cores, and either up performance a little, or reduce power a little. Both seem feasible, my guess for this is perf. With 7nm and generational improvements, 2000 perf should be achievable.FreckledTrout - Wednesday, September 5, 2018 - link
So to hit this they I assume plan to combine a Zen2 and Navi core to make the APU? That does say a little something as to what they expect from the respective products efficiency wise.