Sabrent Rocket Q4 and Corsair MP600 CORE NVMe SSDs Reviewed: PCIe 4.0 with QLC
by Billy Tallis on April 9, 2021 12:45 PM ESTAnandTech Storage Bench - The Destroyer
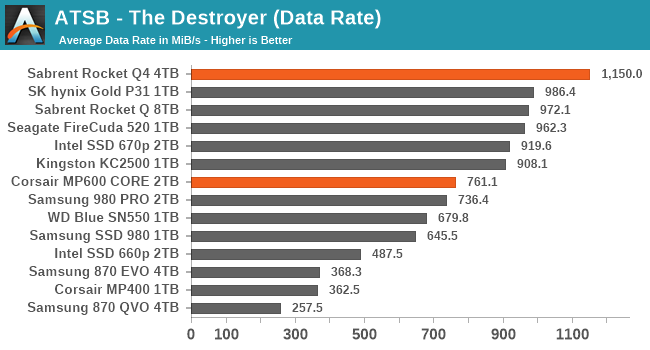
Our AnandTech Storage Bench tests are traces (recordings) of real-world IO patterns that are replayed onto the drives under test. The Destroyer is the longest and most difficult phase of our consumer SSD test suite. For more details, please see the overview of our 2021 Consumer SSD Benchmark Suite.
 |
|||||||||
| Average Data Rate | |||||||||
| Average Latency | Average Read Latency | Average Write Latency | |||||||
| 99th Percentile Latency | 99th Percentile Read Latency | 99th Percentile Write Latency | |||||||
| Energy Usage | |||||||||
The 4TB Sabrent Rocket Q4 turns in excellent scores on The Destroyer, helped greatly by the fact that the test fits entirely within the drive's SLC cache so write latency is minimal. The 2TB Corsair MP600 CORE still has decent overall performance with solid 99th percentile latency scores indicating that it doesn't run into the kind of severe latency spikes that can be common with QLC NAND.
The major downside is that these are among the most power-hungry drives, consuming a bit more energy than the TLC-based Phison E16 drive and significantly more than any of the other drives in this batch.
AnandTech Storage Bench - Heavy
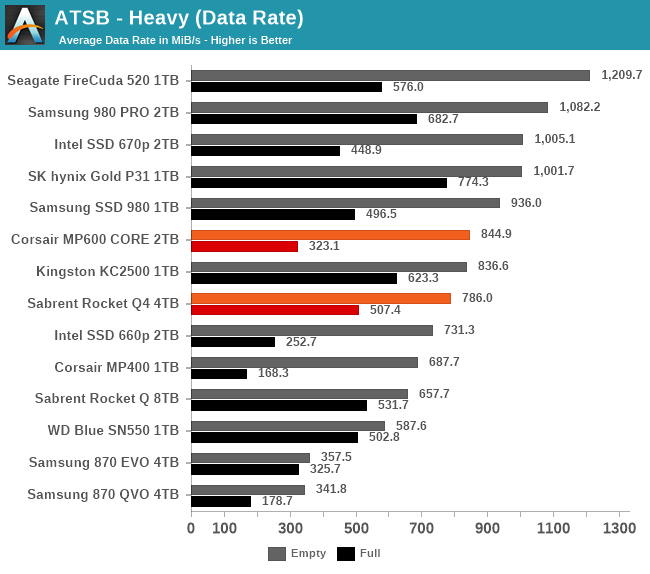
The ATSB Heavy test is much shorter overall than The Destroyer, but is still fairly write-intensive. We run this test twice: first on a mostly-empty drive, and again on a completely full drive to show the worst-case performance.
 |
|||||||||
| Average Data Rate | |||||||||
| Average Latency | Average Read Latency | Average Write Latency | |||||||
| 99th Percentile Latency | 99th Percentile Read Latency | 99th Percentile Write Latency | |||||||
| Energy Usage | |||||||||
The shorter duration of the Heavy test means that smaller drives can also get good mileage out of their SLC caches, so the 4TB Sabrent Rocket Q4 loses the advantage it had on The Destroyer. The Rocket Q4 and the Corsair MP600 CORE both turn in good scores overall for low-end drives, with clear improvement over the Phison E12 QLC drives.
However, on the full-drive test runs the 2TB MP600 CORE is showing some elevated latency. It's not as bad as on QLC SATA drives and some competing QLC NVMe drives, so overall this isn't a serious concern, but it does emphasize how QLC SSDs need a lot of capacity (and a lot of SLC cache) in order to stay close to the performance of TLC SSDs.
AnandTech Storage Bench - Light
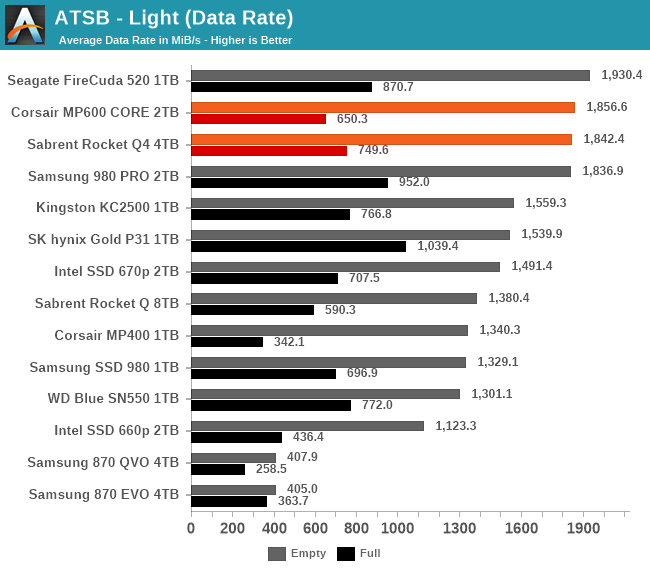
The ATSB Light test represents ordinary everyday usage that doesn't put much strain on a SSD. Low queue depths, short bursts of IO and a short overall test duration mean this should be easy for any SSD. But running it a second time on a full drive shows how even storage-light workloads can be affected by SSD performance degradation.
 |
|||||||||
| Average Data Rate | |||||||||
| Average Latency | Average Read Latency | Average Write Latency | |||||||
| 99th Percentile Latency | 99th Percentile Read Latency | 99th Percentile Write Latency | |||||||
| Energy Usage | |||||||||
Both of the Gen4 QLC drives provide top-tier performance for the empty-drive runs of the Light test, and they also still provide acceptable performance on the full-drive test runs with no serious latency spikes. As with the other ATSB tests, they come in last place for energy efficiency.
PCMark 10 Storage Benchmarks
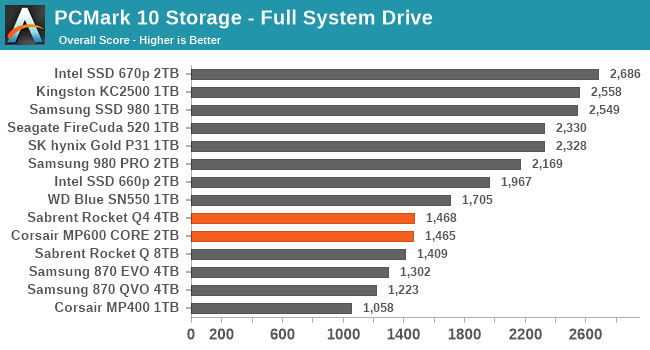
The PCMark 10 Storage benchmarks are IO trace based tests similar to our own ATSB tests. For more details, please see the overview of our 2021 Consumer SSD Benchmark Suite.
 |
|||||||||
| Full System Drive | Overall Score | Average Bandwidth | Average Latency | ||||||
| Quick System Drive | Overall Score | Average Bandwidth | Average Latency | ||||||
| Data Drive | Overall Score | Average Bandwidth | Average Latency | ||||||
The two PCIe Gen4 QLC drives offer good performance on the Quick System Drive and Data Drive tests, which are relatively shorter and more focused on sequential IO. The longer Full System Drive test with more random IO stresses these drives enough for their low-end nature to show through - in stark contrast to the Intel SSD 670p that manages very good scores on both of the system drive tests.


60 Comments
View All Comments
cyrusfox - Friday, April 9, 2021 - link
Great write up, unfortunate endurance regression (Went from 260 down to 225 cycles), seems only Intel is pushing QLC higher on endurance (200 to 300 to 370 cycles). Impressive random performance though, odd that only Intel appears to be extracting higher endurance with each new gen of QLC though.Samus - Sunday, April 11, 2021 - link
I noticed that in the 670p review and I'm glad someone pointed it out. I'd like to know if it's a programming\firmware logic thing that extracts better endurance through creative block wear leveling, reduced write amplification (perhaps delayed garbage collection and stuff) or they have more spare area? It's hard to believe they have superior manufacturing compared to "everyone" but maybe they do...Oxford Guy - Sunday, April 11, 2021 - link
Creativity isn't going to change the fact that there are twice as many voltage states in QLC vs. TLC.cyrusfox - Sunday, April 11, 2021 - link
With PLC on the horizon, QLC is going to look incredible by comparison :)I wonder what the internal goal is to make PLC viable, 70Cycles, 100 cycles? @ 32 Threshold charge states will be an engineering feat all on its own, Impressive QLC is able to function to nearly 400 cycles with 16 separate states(How much are they overprovisioned?).
From what I see in drive warranties based on underlying nand cells, we see around a 1/4 reduction in endurance/cycles each time they increase the bits per cell (10k,2k,400-1.2K,100-375,20-100). QLC is about 4 years old now with mass market release 3 years ago. PLC is definitely on the near horizon.
James5mith - Friday, April 9, 2021 - link
For the minimal price increase, get the E18 based Sabrent Rocket 4 Plus 4TB model. https://www.amazon.com/dp/B08VF99PV8/HideOut - Friday, April 9, 2021 - link
Thats still a big price increase. More than $150 even on sale.TheinsanegamerN - Saturday, April 10, 2021 - link
With far better long term write endurance, write speed, ece. QLC has a nasty habit of slowing WAY down once filled up.Oxford Guy - Sunday, April 11, 2021 - link
It shows its true performance.Once the 'SLC' disguise is gone...
wr3zzz - Friday, April 9, 2021 - link
I don't know why SN550 was used in the performance benchmarks when these QLC drives are priced at premium to SN750.sjkpublic@gmail.com - Friday, April 9, 2021 - link
For QLC write endurance I look at 600 x size. The numbers here are rather poor. Maybe its a mistake?