Sabrent Rocket Q4 and Corsair MP600 CORE NVMe SSDs Reviewed: PCIe 4.0 with QLC
by Billy Tallis on April 9, 2021 12:45 PM ESTAnandTech Storage Bench - The Destroyer
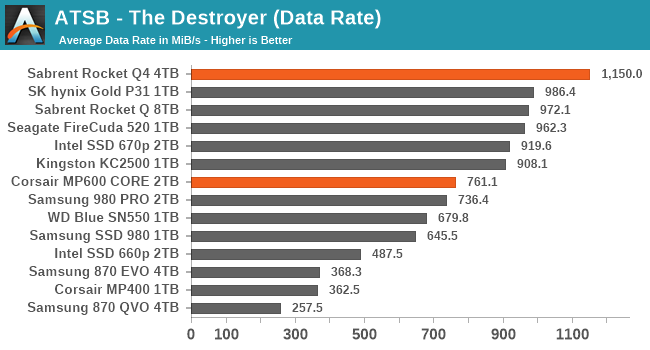
Our AnandTech Storage Bench tests are traces (recordings) of real-world IO patterns that are replayed onto the drives under test. The Destroyer is the longest and most difficult phase of our consumer SSD test suite. For more details, please see the overview of our 2021 Consumer SSD Benchmark Suite.
 |
|||||||||
| Average Data Rate | |||||||||
| Average Latency | Average Read Latency | Average Write Latency | |||||||
| 99th Percentile Latency | 99th Percentile Read Latency | 99th Percentile Write Latency | |||||||
| Energy Usage | |||||||||
The 4TB Sabrent Rocket Q4 turns in excellent scores on The Destroyer, helped greatly by the fact that the test fits entirely within the drive's SLC cache so write latency is minimal. The 2TB Corsair MP600 CORE still has decent overall performance with solid 99th percentile latency scores indicating that it doesn't run into the kind of severe latency spikes that can be common with QLC NAND.
The major downside is that these are among the most power-hungry drives, consuming a bit more energy than the TLC-based Phison E16 drive and significantly more than any of the other drives in this batch.
AnandTech Storage Bench - Heavy
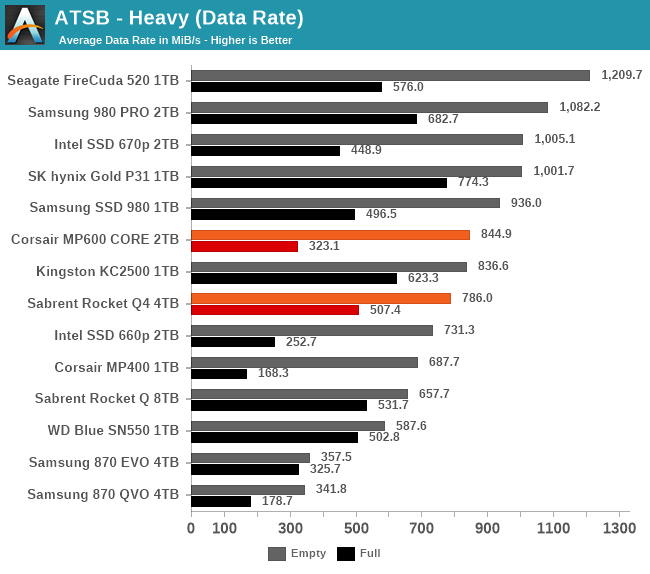
The ATSB Heavy test is much shorter overall than The Destroyer, but is still fairly write-intensive. We run this test twice: first on a mostly-empty drive, and again on a completely full drive to show the worst-case performance.
 |
|||||||||
| Average Data Rate | |||||||||
| Average Latency | Average Read Latency | Average Write Latency | |||||||
| 99th Percentile Latency | 99th Percentile Read Latency | 99th Percentile Write Latency | |||||||
| Energy Usage | |||||||||
The shorter duration of the Heavy test means that smaller drives can also get good mileage out of their SLC caches, so the 4TB Sabrent Rocket Q4 loses the advantage it had on The Destroyer. The Rocket Q4 and the Corsair MP600 CORE both turn in good scores overall for low-end drives, with clear improvement over the Phison E12 QLC drives.
However, on the full-drive test runs the 2TB MP600 CORE is showing some elevated latency. It's not as bad as on QLC SATA drives and some competing QLC NVMe drives, so overall this isn't a serious concern, but it does emphasize how QLC SSDs need a lot of capacity (and a lot of SLC cache) in order to stay close to the performance of TLC SSDs.
AnandTech Storage Bench - Light
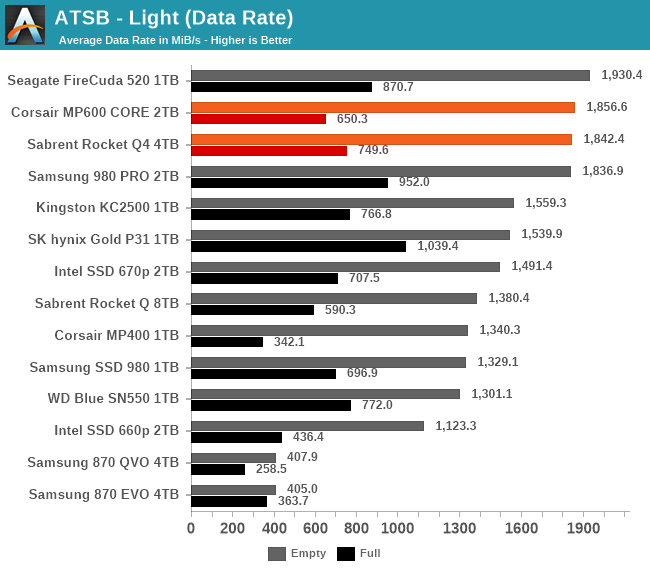
The ATSB Light test represents ordinary everyday usage that doesn't put much strain on a SSD. Low queue depths, short bursts of IO and a short overall test duration mean this should be easy for any SSD. But running it a second time on a full drive shows how even storage-light workloads can be affected by SSD performance degradation.
 |
|||||||||
| Average Data Rate | |||||||||
| Average Latency | Average Read Latency | Average Write Latency | |||||||
| 99th Percentile Latency | 99th Percentile Read Latency | 99th Percentile Write Latency | |||||||
| Energy Usage | |||||||||
Both of the Gen4 QLC drives provide top-tier performance for the empty-drive runs of the Light test, and they also still provide acceptable performance on the full-drive test runs with no serious latency spikes. As with the other ATSB tests, they come in last place for energy efficiency.
PCMark 10 Storage Benchmarks
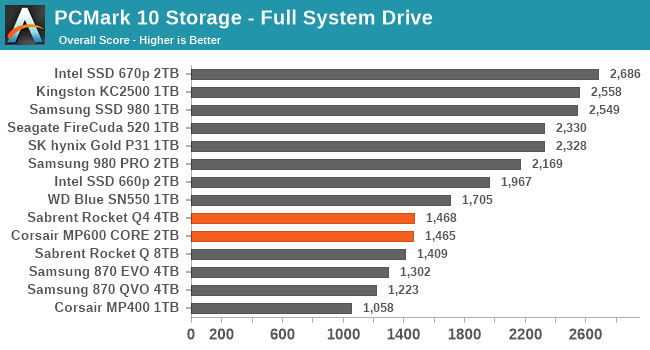
The PCMark 10 Storage benchmarks are IO trace based tests similar to our own ATSB tests. For more details, please see the overview of our 2021 Consumer SSD Benchmark Suite.
 |
|||||||||
| Full System Drive | Overall Score | Average Bandwidth | Average Latency | ||||||
| Quick System Drive | Overall Score | Average Bandwidth | Average Latency | ||||||
| Data Drive | Overall Score | Average Bandwidth | Average Latency | ||||||
The two PCIe Gen4 QLC drives offer good performance on the Quick System Drive and Data Drive tests, which are relatively shorter and more focused on sequential IO. The longer Full System Drive test with more random IO stresses these drives enough for their low-end nature to show through - in stark contrast to the Intel SSD 670p that manages very good scores on both of the system drive tests.


60 Comments
View All Comments
allenb - Sunday, April 11, 2021 - link
This whining about QLC is an amazing mix of comedy and incompetence. Who cares about the storage medium? If your data is written to petrified goose excrement, what does it matter if the delivered performance meets your needs?Faceless corporations screw us over in plenty of legitimate ways. Why make up new things to get pissed off about?
Do the math or look at your actual usage data. Very few individuals are generating enough write traffic for endurance to be a concern. As others have stated here.
JoeDuarte - Sunday, April 11, 2021 - link
Bugs and bad software developers can cause significant degradation of SSD endurance. There was a bug in the Spotify desktop app a couple of years ago that caused massive writes, way beyond normal use, which affected SSD owners the most.And there are apparently issues with Apple's M1 Macbooks, though I haven't kept up. It might have been related to their stingy RAM allotment (8 GB), causing excessive SSD swap.
Endurance will matter when it's as bad as these drives, which is the worst I've ever seen.
Oxford Guy - Tuesday, April 13, 2021 - link
Probably nanosecond timestamps in APFS with various spyware running amok.edzieba - Monday, April 12, 2021 - link
Oh shush, next you'll be telling them that bus interface speed or heatsink presence/size is not an useful indicator of drive performance!ZolaIII - Friday, April 16, 2021 - link
Sure take an example of guy who likes to watch the movies on it's new TV. He whatches 50 movie a month. He takes 4K Blue-ray discs but wants to convert them to 4K HDR + HLG (H265 10 Bit HLG+) format to match the display capabilities as good as possible. In order to do that in real time he uses GPU conversion and as it sucks regarding quality he puts 2x higher bit rate doing so. Of course he first copy them to SSD. That's (50x50) GB x3 = 7.32 TB per month or almost 88 TB per year for one or two muvies every day. When you add rest it comes to at least 100 TB a year. Example is realistic with not to much or extensive usage and illustration of how QLC endurance simply is concerning.FunBunny2 - Saturday, April 17, 2021 - link
"almost 88 TB per year for one or two muvies every day. When you add rest it comes to at least 100 TB a year."well... such a knucklehead obviously doesn't have any time devoted to work, so s/he's either a rich real estate developer or a welfare queen/king. :)
ZolaIII - Sunday, April 18, 2021 - link
Why? If you work from 9 to 5 you don't have time to watch a movie or two (especially if you like watching movies)?DracoDan - Monday, April 19, 2021 - link
They should sell a single SSD that can be user configured as a 4TB QLC, 2TB TLC, 1TB MLC, or 512GB SLC SSD. That way the end user has the ability to decide the tradeoff for space vs performance!Billy Tallis - Tuesday, April 20, 2021 - link
Your math is off, possibly because of the common misunderstanding of the difference between the number of bits stored per memory cell and the number of possible voltage states required to represent those bits.It would be 4TB as QLC, 3TB as TLC, 2TB as MLC or 1TB as SLC. See the Whole-Drive Fill test which illustrates that the 4TB drive has up to 1TB of SLC cache.
xJumpManx - Monday, May 3, 2021 - link
If you have a X570 Taichi do not buy sabrent ssd the mobo does not detect the drive.