Apple's M1 Pro, M1 Max SoCs Investigated: New Performance and Efficiency Heights
by Andrei Frumusanu on October 25, 2021 9:00 AM EST- Posted in
- Laptops
- Apple
- MacBook
- Apple M1 Pro
- Apple M1 Max
Power Behaviour: No Real TDP, but Wide Range
Last year when we reviewed the M1 inside the Mac mini, we did some rough power measurements based on the wall-power of the machine. Since then, we learned how to read out Apple’s individual CPU, GPU, NPU and memory controller power figures, as well as total advertised package power. We repeat the exercise here for the 16” MacBook Pro, focusing on chip package power, as well as AC active wall power, meaning device load power, minus idle power.
Apple doesn’t advertise any TDP for the chips of the devices – it’s our understanding that simply doesn’t exist, and the only limitation to the power draw of the chips and laptops are simply thermals. As long as temperature is kept in check, the silicon will not throttle or not limit itself in terms of power draw. Of course, there’s still an actual average power draw figure when under different scenarios, which is what we come to test here:
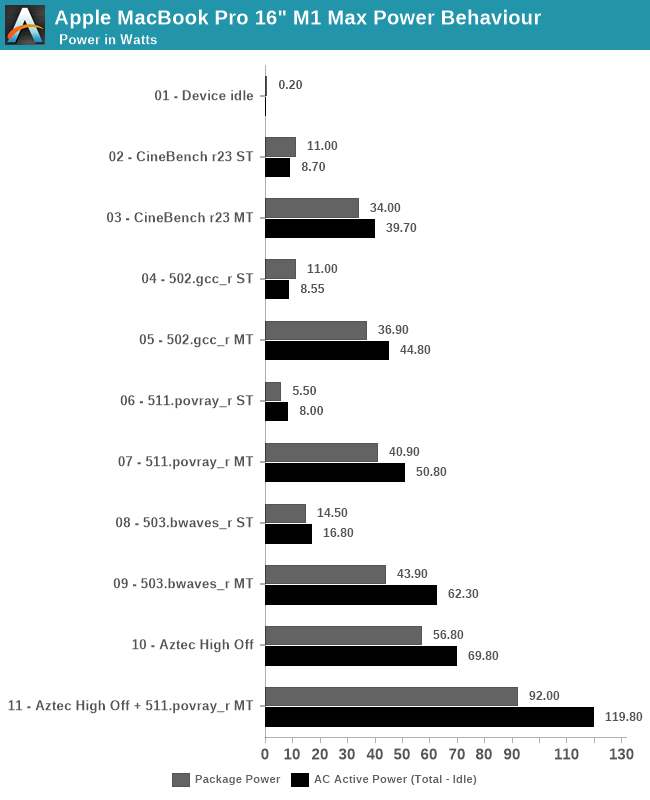
Starting off with device idle, the chip reports a package power of around 200mW when doing nothing but idling on a static screen. This is extremely low compared to competitor designs, and is likely a reason Apple is able achieve such fantastic battery life. The AC wall power under idle was 7.2W, this was on Apple’s included 140W charger, and while the laptop was on minimum display brightness – it’s likely the actual DC battery power under this scenario is much lower, but lacking the ability to measure this, it’s the second-best thing we have. One should probably assume a 90% efficiency figure in the AC-to-DC conversion chain from 230V wall to 28V USB-C MagSafe to whatever the internal PMIC usage voltage of the device is.
In single-threaded workloads, such as CineBench r23 and SPEC 502.gcc_r, both which are more mixed in terms of pure computation vs also memory demanding, we see the chip report 11W package power, however we’re just measuring a 8.5-8.7W difference at the wall when under use. It’s possible the software is over-reporting things here. The actual CPU cluster is only using around 4-5W under this scenario, and we don’t seem to see much of a difference to the M1 in that regard. The package and active power are higher than what we’ve seen on the M1, which could be explained by the much larger memory resources of the M1 Max. 511.povray is mostly core-bound with little memory traffic, package power is reported less, although at the wall again the difference is minor.
In multi-threaded scenarios, the package and wall power vary from 34-43W on package, and wall active power from 40 to 62W. 503.bwaves stands out as having a larger difference between wall power and reported package power – although Apple’s powermetrics showcases a “DRAM” power figure, I think this is just the memory controllers, and that the actual DRAM is not accounted for in the package power figure – the extra wattage that we’re measuring here, because it’s a massive DRAM workload, would be the memory of the M1 Max package.
On the GPU side, we lack notable workloads, but GFXBench Aztec High Offscreen ends up with a 56.8W package figure and 69.80W wall active figure. The GPU block itself is reported to be running at 43W.
Finally, stressing out both CPU and GPU at the same time, the SoC goes up to 92W package power and 120W wall active power. That’s quite high, and we haven’t tested how long the machine is able to sustain such loads (it’s highly environment dependent), but it very much appears that the chip and platform don’t have any practical power limit, and just uses whatever it needs as long as temperatures are in check.
| M1 Max MacBook Pro 16" |
Intel i9-11980HK MSI GE76 Raider |
|||||
| Score | Package Power (W) |
Wall Power Total - Idle (W) |
Score | Package Power (W) |
Wall Power Total - Idle (W) |
|
| Idle | 0.2 | 7.2 (Total) |
1.08 | 13.5 (Total) |
||
| CB23 ST | 1529 | 11.0 | 8.7 | 1604 | 30.0 | 43.5 |
| CB23 MT | 12375 | 34.0 | 39.7 | 12830 | 82.6 | 106.5 |
| 502 ST | 11.9 | 11.0 | 9.5 | 10.7 | 25.5 | 24.5 |
| 502 MT | 74.6 | 36.9 | 44.8 | 46.2 | 72.6 | 109.5 |
| 511 ST | 10.3 | 5.5 | 8.0 | 10.7 | 17.6 | 28.5 |
| 511 MT | 82.7 | 40.9 | 50.8 | 60.1 | 79.5 | 106.5 |
| 503 ST | 57.3 | 14.5 | 16.8 | 44.2 | 19.5 | 31.5 |
| 503 MT | 295.7 | 43.9 | 62.3 | 60.4 | 58.3 | 80.5 |
| Aztec High Off | 307fps | 56.8 | 69.8 | 266fps | 35 + 144 | 200.5 |
| Aztec+511MT | 92.0 | 119.8 | 78 + 142 | 256.5 | ||
Comparing the M1 Max against the competition, we resorted to Intel’s 11980HK on the MSI GE76 Raider. Unfortunately, we wanted to also do a comparison against AMD’s 5980HS, however our test machine is dead.
In single-threaded workloads, Apple’s showcases massive performance and power advantages against Intel’s best CPU. In CineBench, it’s one of the rare workloads where Apple’s cores lose out in performance for some reason, but this further widens the gap in terms of power usage, whereas the M1 Max only uses 8.7W, while a comparable figure on the 11980HK is 43.5W.
In other ST workloads, the M1 Max is more ahead in performance, or at least in a similar range. The performance/W difference here is around 2.5x to 3x in favour of Apple’s silicon.
In multi-threaded tests, the 11980HK is clearly allowed to go to much higher power levels than the M1 Max, reaching package power levels of 80W, for 105-110W active wall power, significantly more than what the MacBook Pro here is drawing. The performance levels of the M1 Max are significantly higher than the Intel chip here, due to the much better scalability of the cores. The perf/W differences here are 4-6x in favour of the M1 Max, all whilst posting significantly better performance, meaning the perf/W at ISO-perf would be even higher than this.
On the GPU side, the GE76 Raider comes with a GTX 3080 mobile. On Aztec High, this uses a total of 200W power for 266fps, while the M1 Max beats it at 307fps with just 70W wall active power. The package powers for the MSI system are reported at 35+144W.
Finally, the Intel and GeForce GPU go up to 256W power daw when used together, also more than double that of the MacBook Pro and its M1 Max SoC.
The 11980HK isn’t a very efficient chip, as we had noted it back in our May review, and AMD’s chips should fare quite a bit better in a comparison, however the Apple Silicon is likely still ahead by extremely comfortable margins.


493 Comments
View All Comments
Ppietra - Tuesday, October 26, 2021 - link
anyone can compile SPEC and see the source codePpietra - Monday, October 25, 2021 - link
There aren’t that many games that are actually optimized for Apple’s hardware so you cannot actually extrapolate to other case scenarios, though we shouldn’t expect to be the best anyway. We should look for other kind of workloads to see out it behaves.SPEC uses a lot of different real world tasks.
FurryFireball - Wednesday, October 27, 2021 - link
World of Warcraft is optimized for the M1Ppietra - Wednesday, October 27, 2021 - link
true, but it isn’t one of the games that were tested.What I meant is that people seem to be drawing conclusions about hardware based on games that have almost no optimisation.
The Hardcard - Monday, October 25, 2021 - link
Please provide 1 example of the M1 falling behind on native code. As far as games, we’ll see if maybe one developer will dip a toe in with a native game. I wouldn’t buy one of these now if gaming was a prority.But note, these SPEC scores are unoptimized and independently compiled, so there are no benchmark tricks here. Imagine what the scores would be if time was taken to optimize to the architecture’s strengths.
name99 - Monday, October 25, 2021 - link
Oh the internet...- Idiot fringe A complaining that "SPEC results don't count because Apple didn't submit properly tuned and optimized results".
- Meanwhile, simultaneously, Idiot fringe B complaining that "Apple cheats on benchmarks because they once, 20 years ago, in fact tried to create tuned and optimized SPEC results".
sean8102 - Tuesday, October 26, 2021 - link
From what I can find Baldur's Gate 3 and WoW are the only 2 demanding games that are ARM native on macOS.https://www.applegamingwiki.com/wiki/M1_native_com...
michael2k - Monday, October 25, 2021 - link
From the article, yes, the benchmark does show the M1M beating the 3080 and Intel/AMD:On the GPU side, the GE76 Raider comes with a GTX 3080 mobile. On Aztec High, this uses a total of 200W power for 266fps, while the M1 Max beats it at 307fps with just 70W wall active power. The package powers for the MSI system are reported at 35+144W.
In the SPECfp suite, the M1 Max is in its own category of silicon with no comparison in the market. It completely demolishes any laptop contender, showcasing 2.2x performance of the second-best laptop chip. The M1 Max even manages to outperform the 16-core 5950X – a chip whose package power is at 142W, with rest of system even quite above that. It’s an absolutely absurd comparison and a situation we haven’t seen the likes of.
However, your assertion regarding applications seems completely opposite what the review found:
With that said, the GPU performance of the new chips relative to the best in the world of Windows is all over the place. GFXBench looks really good, as do the MacBooks’ performance productivity workloads. For the true professionals out there – the people using cameras that cost as much as a MacBook Pro and software packages that are only slightly cheaper – the M1 Pro and M1 Max should prove very welcome. There is a massive amount of pixel pushing power available in these SoCs, so long as you have the workload required to put it to good use.
taligentia - Monday, October 25, 2021 - link
Did you even read the article ?The "real world" 3080 scenarios were done using Rosetta emulated apps.
When you look at GPU intensive apps e.g. Davinci Resolve it is seeing staggering performance.
vlad42 - Monday, October 25, 2021 - link
Did you read the article? Andrei made sure the UHD benchmarks were GPU bound, not CPU bound (which would be the case if it were a Rosetta issue).