Apple's M1 Pro, M1 Max SoCs Investigated: New Performance and Efficiency Heights
by Andrei Frumusanu on October 25, 2021 9:00 AM EST- Posted in
- Laptops
- Apple
- MacBook
- Apple M1 Pro
- Apple M1 Max
Power Behaviour: No Real TDP, but Wide Range
Last year when we reviewed the M1 inside the Mac mini, we did some rough power measurements based on the wall-power of the machine. Since then, we learned how to read out Apple’s individual CPU, GPU, NPU and memory controller power figures, as well as total advertised package power. We repeat the exercise here for the 16” MacBook Pro, focusing on chip package power, as well as AC active wall power, meaning device load power, minus idle power.
Apple doesn’t advertise any TDP for the chips of the devices – it’s our understanding that simply doesn’t exist, and the only limitation to the power draw of the chips and laptops are simply thermals. As long as temperature is kept in check, the silicon will not throttle or not limit itself in terms of power draw. Of course, there’s still an actual average power draw figure when under different scenarios, which is what we come to test here:
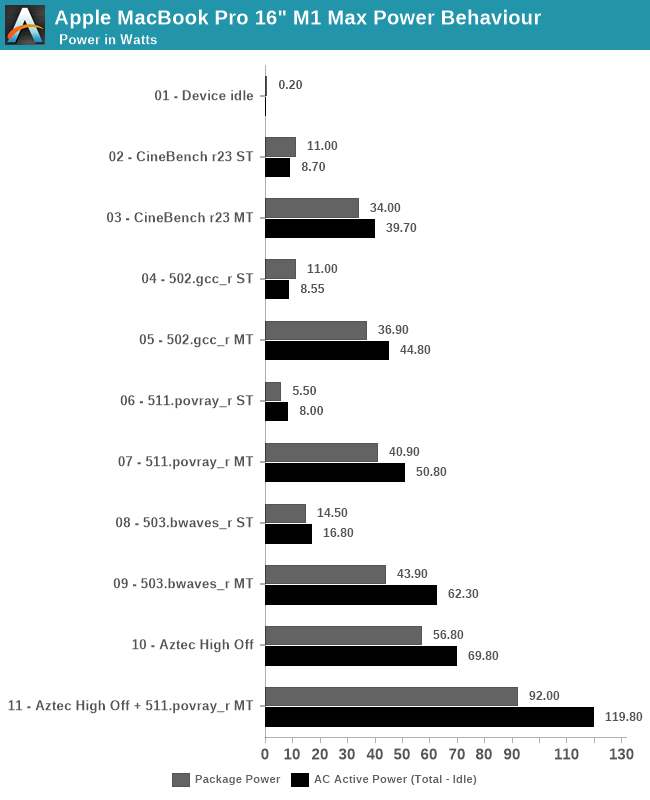
Starting off with device idle, the chip reports a package power of around 200mW when doing nothing but idling on a static screen. This is extremely low compared to competitor designs, and is likely a reason Apple is able achieve such fantastic battery life. The AC wall power under idle was 7.2W, this was on Apple’s included 140W charger, and while the laptop was on minimum display brightness – it’s likely the actual DC battery power under this scenario is much lower, but lacking the ability to measure this, it’s the second-best thing we have. One should probably assume a 90% efficiency figure in the AC-to-DC conversion chain from 230V wall to 28V USB-C MagSafe to whatever the internal PMIC usage voltage of the device is.
In single-threaded workloads, such as CineBench r23 and SPEC 502.gcc_r, both which are more mixed in terms of pure computation vs also memory demanding, we see the chip report 11W package power, however we’re just measuring a 8.5-8.7W difference at the wall when under use. It’s possible the software is over-reporting things here. The actual CPU cluster is only using around 4-5W under this scenario, and we don’t seem to see much of a difference to the M1 in that regard. The package and active power are higher than what we’ve seen on the M1, which could be explained by the much larger memory resources of the M1 Max. 511.povray is mostly core-bound with little memory traffic, package power is reported less, although at the wall again the difference is minor.
In multi-threaded scenarios, the package and wall power vary from 34-43W on package, and wall active power from 40 to 62W. 503.bwaves stands out as having a larger difference between wall power and reported package power – although Apple’s powermetrics showcases a “DRAM” power figure, I think this is just the memory controllers, and that the actual DRAM is not accounted for in the package power figure – the extra wattage that we’re measuring here, because it’s a massive DRAM workload, would be the memory of the M1 Max package.
On the GPU side, we lack notable workloads, but GFXBench Aztec High Offscreen ends up with a 56.8W package figure and 69.80W wall active figure. The GPU block itself is reported to be running at 43W.
Finally, stressing out both CPU and GPU at the same time, the SoC goes up to 92W package power and 120W wall active power. That’s quite high, and we haven’t tested how long the machine is able to sustain such loads (it’s highly environment dependent), but it very much appears that the chip and platform don’t have any practical power limit, and just uses whatever it needs as long as temperatures are in check.
| M1 Max MacBook Pro 16" |
Intel i9-11980HK MSI GE76 Raider |
|||||
| Score | Package Power (W) |
Wall Power Total - Idle (W) |
Score | Package Power (W) |
Wall Power Total - Idle (W) |
|
| Idle | 0.2 | 7.2 (Total) |
1.08 | 13.5 (Total) |
||
| CB23 ST | 1529 | 11.0 | 8.7 | 1604 | 30.0 | 43.5 |
| CB23 MT | 12375 | 34.0 | 39.7 | 12830 | 82.6 | 106.5 |
| 502 ST | 11.9 | 11.0 | 9.5 | 10.7 | 25.5 | 24.5 |
| 502 MT | 74.6 | 36.9 | 44.8 | 46.2 | 72.6 | 109.5 |
| 511 ST | 10.3 | 5.5 | 8.0 | 10.7 | 17.6 | 28.5 |
| 511 MT | 82.7 | 40.9 | 50.8 | 60.1 | 79.5 | 106.5 |
| 503 ST | 57.3 | 14.5 | 16.8 | 44.2 | 19.5 | 31.5 |
| 503 MT | 295.7 | 43.9 | 62.3 | 60.4 | 58.3 | 80.5 |
| Aztec High Off | 307fps | 56.8 | 69.8 | 266fps | 35 + 144 | 200.5 |
| Aztec+511MT | 92.0 | 119.8 | 78 + 142 | 256.5 | ||
Comparing the M1 Max against the competition, we resorted to Intel’s 11980HK on the MSI GE76 Raider. Unfortunately, we wanted to also do a comparison against AMD’s 5980HS, however our test machine is dead.
In single-threaded workloads, Apple’s showcases massive performance and power advantages against Intel’s best CPU. In CineBench, it’s one of the rare workloads where Apple’s cores lose out in performance for some reason, but this further widens the gap in terms of power usage, whereas the M1 Max only uses 8.7W, while a comparable figure on the 11980HK is 43.5W.
In other ST workloads, the M1 Max is more ahead in performance, or at least in a similar range. The performance/W difference here is around 2.5x to 3x in favour of Apple’s silicon.
In multi-threaded tests, the 11980HK is clearly allowed to go to much higher power levels than the M1 Max, reaching package power levels of 80W, for 105-110W active wall power, significantly more than what the MacBook Pro here is drawing. The performance levels of the M1 Max are significantly higher than the Intel chip here, due to the much better scalability of the cores. The perf/W differences here are 4-6x in favour of the M1 Max, all whilst posting significantly better performance, meaning the perf/W at ISO-perf would be even higher than this.
On the GPU side, the GE76 Raider comes with a GTX 3080 mobile. On Aztec High, this uses a total of 200W power for 266fps, while the M1 Max beats it at 307fps with just 70W wall active power. The package powers for the MSI system are reported at 35+144W.
Finally, the Intel and GeForce GPU go up to 256W power daw when used together, also more than double that of the MacBook Pro and its M1 Max SoC.
The 11980HK isn’t a very efficient chip, as we had noted it back in our May review, and AMD’s chips should fare quite a bit better in a comparison, however the Apple Silicon is likely still ahead by extremely comfortable margins.


493 Comments
View All Comments
techconc - Monday, October 25, 2021 - link
I guess you missed the section where they showed the massive performance gains for the various content creation applications.GatesDA - Monday, October 25, 2021 - link
Apple currently has the benefit of an advanced manufacturing process. If it feels like future tech compared to Intel/AMD, that's because it is. The real test will be if it still holds up when x86 chips are on equal footing.Notably, going from M1 Pro to Max adds more transistors than the 3080 has TOTAL. This wouldn't be feasible without the transistor density of TSMC's N5 process. M1's massive performance CPU cores also benefit from the extra transistor density.
Samsung and Intel getting serious about fabrication mean it'll be much harder for future Apple chips to maintain a process advantage. From the current roadmaps they'll actually fall behind, at least for a while.
michael2k - Monday, October 25, 2021 - link
That's a tautology and therefore a fallacy and bad logic:Apple is only ahead because they're ahead. When they fall behind they will fall behind.
You can deconstruct your fallacy by asking this:
When will Intel get ahead of Apple? The answer is never, at least according to Intel itself:
https://appleinsider.com/articles/21/03/23/now-int...
By the time Intel has surpassed TSMC, it means Intel will need to have many more customers to absorb the costs of surpassing TSMC, because it means Intel's process advantage will be too expensive to maintain without the customer base of TSMC.
kwohlt - Tuesday, October 26, 2021 - link
It's pretty clear that Apple will never go back to x86/64, and that they will be using in-house designed custom silicon for their Macs. Doesn't matter how good AMD or Intel get, Apple's roadmap on that front is set in stone for as far into the future as corporate roadmaps are made.Intel saying they hope to one day get A and M series manufacturing contracts suggests they're confident about their ability to rival TSMC in a few years, not that they will never be able to reach Apple Silicon perf/watt.
Intel def won't come close to M series in perf/watt until at least 2025 with Royal Core Project, and even then, who knows, still probably not.
daveinpublic - Monday, October 25, 2021 - link
So by your logic, Apple is ahead right now.Samsung and Intel are behind right now. And could be for a while.
Sunrise089 - Tuesday, October 26, 2021 - link
The Apple chips have perf/watt numbers in some instances 400% better than the Intel competition. Just how much benefit are you expecting a node shrink to provide? Are you seriously suggesting Intel would see a doubling, tripling, or even quadrupling of perf/watt via moving to a smaller node? You are aware node shrink efficiency gains don’t remotely approach that level of improvement be it on Intel or TSMC, aren’t you?“Samsung and Intel getting serious about fabrication.” What does this even mean? Intel has been the world leader in fabrication investment and technology for decades before recently falling behind. How on earth could you possibly consider them not ‘serious’ about it?
AshlayW - Tuesday, October 26, 2021 - link
Firestorm cores have >2X the transistors as Zen3/Sunny Cove cores in >2X the area on the same process (or slightly less). The cores are designed to be significantly wider making use of the N5 process, and yes, I very much expect at LEAST a doubling of perf/w from N5 CPUs from AMD, since they doubled Ryzen 2000 with 3000, and +25% from 3000 to 5000 on the same N7 node.kwohlt - Tuesday, October 26, 2021 - link
Ryzen 3000 doubled perf/watt over Ryzen 2000?? Which workloads on which SKUs are you comparing?dada_dave - Monday, October 25, 2021 - link
So I wonder why Geekbench scores have so far shown M1Max very far off it's expected score relative to the M1 (22K)? I've checked other GPUs in its score range across a variety of APIs (including Metal) and so far they all show the expected scaling (or close enough) between TFLOP and GB score except the M1 Max. Even the 24 core Max is not that far off, it's the 32 core scores are really far off. They should be in the 70Ks or even high 80Ks for perfect scaling which is achieved by the 16-core Pro GPU, but the 32-core scores are actually in the upper 50Ks/low 60Ks. Do you have any hypotheses as to why that is? Also does the 16" have the high performance mode supposedly coming (or here already)?Andrei Frumusanu - Monday, October 25, 2021 - link
The GB compute is too short in bursts and the GPU isn't ramping up to peak frequencies. Just ignore it.