Apple's M1 Pro, M1 Max SoCs Investigated: New Performance and Efficiency Heights
by Andrei Frumusanu on October 25, 2021 9:00 AM EST- Posted in
- Laptops
- Apple
- MacBook
- Apple M1 Pro
- Apple M1 Max
Power Behaviour: No Real TDP, but Wide Range
Last year when we reviewed the M1 inside the Mac mini, we did some rough power measurements based on the wall-power of the machine. Since then, we learned how to read out Apple’s individual CPU, GPU, NPU and memory controller power figures, as well as total advertised package power. We repeat the exercise here for the 16” MacBook Pro, focusing on chip package power, as well as AC active wall power, meaning device load power, minus idle power.
Apple doesn’t advertise any TDP for the chips of the devices – it’s our understanding that simply doesn’t exist, and the only limitation to the power draw of the chips and laptops are simply thermals. As long as temperature is kept in check, the silicon will not throttle or not limit itself in terms of power draw. Of course, there’s still an actual average power draw figure when under different scenarios, which is what we come to test here:
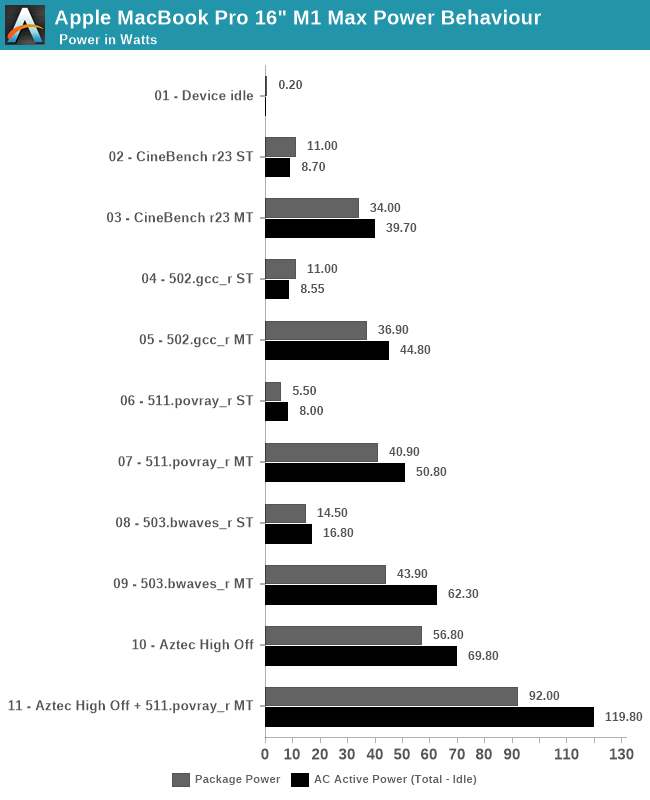
Starting off with device idle, the chip reports a package power of around 200mW when doing nothing but idling on a static screen. This is extremely low compared to competitor designs, and is likely a reason Apple is able achieve such fantastic battery life. The AC wall power under idle was 7.2W, this was on Apple’s included 140W charger, and while the laptop was on minimum display brightness – it’s likely the actual DC battery power under this scenario is much lower, but lacking the ability to measure this, it’s the second-best thing we have. One should probably assume a 90% efficiency figure in the AC-to-DC conversion chain from 230V wall to 28V USB-C MagSafe to whatever the internal PMIC usage voltage of the device is.
In single-threaded workloads, such as CineBench r23 and SPEC 502.gcc_r, both which are more mixed in terms of pure computation vs also memory demanding, we see the chip report 11W package power, however we’re just measuring a 8.5-8.7W difference at the wall when under use. It’s possible the software is over-reporting things here. The actual CPU cluster is only using around 4-5W under this scenario, and we don’t seem to see much of a difference to the M1 in that regard. The package and active power are higher than what we’ve seen on the M1, which could be explained by the much larger memory resources of the M1 Max. 511.povray is mostly core-bound with little memory traffic, package power is reported less, although at the wall again the difference is minor.
In multi-threaded scenarios, the package and wall power vary from 34-43W on package, and wall active power from 40 to 62W. 503.bwaves stands out as having a larger difference between wall power and reported package power – although Apple’s powermetrics showcases a “DRAM” power figure, I think this is just the memory controllers, and that the actual DRAM is not accounted for in the package power figure – the extra wattage that we’re measuring here, because it’s a massive DRAM workload, would be the memory of the M1 Max package.
On the GPU side, we lack notable workloads, but GFXBench Aztec High Offscreen ends up with a 56.8W package figure and 69.80W wall active figure. The GPU block itself is reported to be running at 43W.
Finally, stressing out both CPU and GPU at the same time, the SoC goes up to 92W package power and 120W wall active power. That’s quite high, and we haven’t tested how long the machine is able to sustain such loads (it’s highly environment dependent), but it very much appears that the chip and platform don’t have any practical power limit, and just uses whatever it needs as long as temperatures are in check.
| M1 Max MacBook Pro 16" |
Intel i9-11980HK MSI GE76 Raider |
|||||
| Score | Package Power (W) |
Wall Power Total - Idle (W) |
Score | Package Power (W) |
Wall Power Total - Idle (W) |
|
| Idle | 0.2 | 7.2 (Total) |
1.08 | 13.5 (Total) |
||
| CB23 ST | 1529 | 11.0 | 8.7 | 1604 | 30.0 | 43.5 |
| CB23 MT | 12375 | 34.0 | 39.7 | 12830 | 82.6 | 106.5 |
| 502 ST | 11.9 | 11.0 | 9.5 | 10.7 | 25.5 | 24.5 |
| 502 MT | 74.6 | 36.9 | 44.8 | 46.2 | 72.6 | 109.5 |
| 511 ST | 10.3 | 5.5 | 8.0 | 10.7 | 17.6 | 28.5 |
| 511 MT | 82.7 | 40.9 | 50.8 | 60.1 | 79.5 | 106.5 |
| 503 ST | 57.3 | 14.5 | 16.8 | 44.2 | 19.5 | 31.5 |
| 503 MT | 295.7 | 43.9 | 62.3 | 60.4 | 58.3 | 80.5 |
| Aztec High Off | 307fps | 56.8 | 69.8 | 266fps | 35 + 144 | 200.5 |
| Aztec+511MT | 92.0 | 119.8 | 78 + 142 | 256.5 | ||
Comparing the M1 Max against the competition, we resorted to Intel’s 11980HK on the MSI GE76 Raider. Unfortunately, we wanted to also do a comparison against AMD’s 5980HS, however our test machine is dead.
In single-threaded workloads, Apple’s showcases massive performance and power advantages against Intel’s best CPU. In CineBench, it’s one of the rare workloads where Apple’s cores lose out in performance for some reason, but this further widens the gap in terms of power usage, whereas the M1 Max only uses 8.7W, while a comparable figure on the 11980HK is 43.5W.
In other ST workloads, the M1 Max is more ahead in performance, or at least in a similar range. The performance/W difference here is around 2.5x to 3x in favour of Apple’s silicon.
In multi-threaded tests, the 11980HK is clearly allowed to go to much higher power levels than the M1 Max, reaching package power levels of 80W, for 105-110W active wall power, significantly more than what the MacBook Pro here is drawing. The performance levels of the M1 Max are significantly higher than the Intel chip here, due to the much better scalability of the cores. The perf/W differences here are 4-6x in favour of the M1 Max, all whilst posting significantly better performance, meaning the perf/W at ISO-perf would be even higher than this.
On the GPU side, the GE76 Raider comes with a GTX 3080 mobile. On Aztec High, this uses a total of 200W power for 266fps, while the M1 Max beats it at 307fps with just 70W wall active power. The package powers for the MSI system are reported at 35+144W.
Finally, the Intel and GeForce GPU go up to 256W power daw when used together, also more than double that of the MacBook Pro and its M1 Max SoC.
The 11980HK isn’t a very efficient chip, as we had noted it back in our May review, and AMD’s chips should fare quite a bit better in a comparison, however the Apple Silicon is likely still ahead by extremely comfortable margins.


493 Comments
View All Comments
unclevagz - Monday, October 25, 2021 - link
Is the M1 Max here being tested on the so called "high power" mode?Andrei Frumusanu - Monday, October 25, 2021 - link
No.unclevagz - Monday, October 25, 2021 - link
Is the high power mode a selectable option on your review unit?Ryan Smith - Monday, October 25, 2021 - link
It's selectable on the 16-inch models. However it's not needed for anything short of the heaviest combined CPU + GPU workloads. Any pure CPU or GPU workload doesn't come close to the thermal limits of the machine. And even a moderate mixed workload like Premiere Pro didn't benefit from High Power mode.It has a reason to exist, but that reason is close to rendering a video overnight - as in a very hard and very sustained total system workload.
unclevagz - Monday, October 25, 2021 - link
So from your comment, I take it that the high power mode doesn't do anything to performance except allow the fans to kick in more aggressively rather than clock down the CPU/GPU in thermally limited scenarios?hmw - Monday, October 25, 2021 - link
Ryan, Andrei - so would the high power mode be something that prevents throttling or frequency downshifting when running sustained CPU + GPU workloads that might otherwise cause the machine to throttle or run over the combined limit (example > 120W ) ? If so, makes sense - it's just adjusting the power profile much like in Windows ...Just trying to decide between the lighter 14" and the heavier 16", seems like both models score equally well on the benchmarks otherwise ...
Ryan Smith - Tuesday, October 26, 2021 - link
" so would the high power mode be something that prevents throttling or frequency downshifting when running sustained CPU + GPU workloads that might otherwise cause the machine to throttle or run over the combined limit (example > 120W ) ? "Correct.
But being aware of the throttling issues on the Touch Bar 15/16 Inch MBPs, I should emphasize that we're not seeing throttling to begin with. Even "typical" heavy workloads like games aren't having problems. HP mode exists because there are edge cases, but unlike past MBPs, it seems you have to really work at it to find them.
BillBear - Monday, October 25, 2021 - link
I would expect "high power" mode to just be "crank the fans up and leave them up" mode.For instance, that MSI GE76 Raider with a GTX 3080 has such a mode:
>The downside of the extreme performance mode though is noise, with the system peaking around 55 dB(A) measured one inch over the trackpad. If you are going to run at maximum, you would really need closed-back earphones to try and remove some of the noise.
https://www.anandtech.com/show/16928/the-msi-ge76-...
Tyrone91 - Monday, October 25, 2021 - link
No Cinebench R23? Those R23 MT scores seem much closer to the Intel/AMD laptop chips.sirmo - Monday, October 25, 2021 - link
The only useful test I wanted to see. What's weird is it's present in the power consumption chart. So why not post the results?