Apple's M1 Pro, M1 Max SoCs Investigated: New Performance and Efficiency Heights
by Andrei Frumusanu on October 25, 2021 9:00 AM EST- Posted in
- Laptops
- Apple
- MacBook
- Apple M1 Pro
- Apple M1 Max
Power Behaviour: No Real TDP, but Wide Range
Last year when we reviewed the M1 inside the Mac mini, we did some rough power measurements based on the wall-power of the machine. Since then, we learned how to read out Apple’s individual CPU, GPU, NPU and memory controller power figures, as well as total advertised package power. We repeat the exercise here for the 16” MacBook Pro, focusing on chip package power, as well as AC active wall power, meaning device load power, minus idle power.
Apple doesn’t advertise any TDP for the chips of the devices – it’s our understanding that simply doesn’t exist, and the only limitation to the power draw of the chips and laptops are simply thermals. As long as temperature is kept in check, the silicon will not throttle or not limit itself in terms of power draw. Of course, there’s still an actual average power draw figure when under different scenarios, which is what we come to test here:
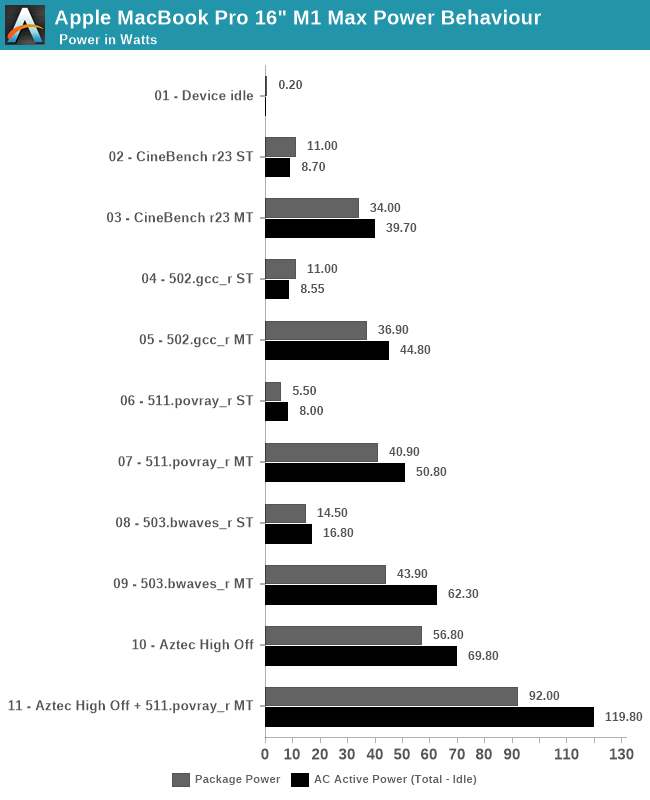
Starting off with device idle, the chip reports a package power of around 200mW when doing nothing but idling on a static screen. This is extremely low compared to competitor designs, and is likely a reason Apple is able achieve such fantastic battery life. The AC wall power under idle was 7.2W, this was on Apple’s included 140W charger, and while the laptop was on minimum display brightness – it’s likely the actual DC battery power under this scenario is much lower, but lacking the ability to measure this, it’s the second-best thing we have. One should probably assume a 90% efficiency figure in the AC-to-DC conversion chain from 230V wall to 28V USB-C MagSafe to whatever the internal PMIC usage voltage of the device is.
In single-threaded workloads, such as CineBench r23 and SPEC 502.gcc_r, both which are more mixed in terms of pure computation vs also memory demanding, we see the chip report 11W package power, however we’re just measuring a 8.5-8.7W difference at the wall when under use. It’s possible the software is over-reporting things here. The actual CPU cluster is only using around 4-5W under this scenario, and we don’t seem to see much of a difference to the M1 in that regard. The package and active power are higher than what we’ve seen on the M1, which could be explained by the much larger memory resources of the M1 Max. 511.povray is mostly core-bound with little memory traffic, package power is reported less, although at the wall again the difference is minor.
In multi-threaded scenarios, the package and wall power vary from 34-43W on package, and wall active power from 40 to 62W. 503.bwaves stands out as having a larger difference between wall power and reported package power – although Apple’s powermetrics showcases a “DRAM” power figure, I think this is just the memory controllers, and that the actual DRAM is not accounted for in the package power figure – the extra wattage that we’re measuring here, because it’s a massive DRAM workload, would be the memory of the M1 Max package.
On the GPU side, we lack notable workloads, but GFXBench Aztec High Offscreen ends up with a 56.8W package figure and 69.80W wall active figure. The GPU block itself is reported to be running at 43W.
Finally, stressing out both CPU and GPU at the same time, the SoC goes up to 92W package power and 120W wall active power. That’s quite high, and we haven’t tested how long the machine is able to sustain such loads (it’s highly environment dependent), but it very much appears that the chip and platform don’t have any practical power limit, and just uses whatever it needs as long as temperatures are in check.
| M1 Max MacBook Pro 16" |
Intel i9-11980HK MSI GE76 Raider |
|||||
| Score | Package Power (W) |
Wall Power Total - Idle (W) |
Score | Package Power (W) |
Wall Power Total - Idle (W) |
|
| Idle | 0.2 | 7.2 (Total) |
1.08 | 13.5 (Total) |
||
| CB23 ST | 1529 | 11.0 | 8.7 | 1604 | 30.0 | 43.5 |
| CB23 MT | 12375 | 34.0 | 39.7 | 12830 | 82.6 | 106.5 |
| 502 ST | 11.9 | 11.0 | 9.5 | 10.7 | 25.5 | 24.5 |
| 502 MT | 74.6 | 36.9 | 44.8 | 46.2 | 72.6 | 109.5 |
| 511 ST | 10.3 | 5.5 | 8.0 | 10.7 | 17.6 | 28.5 |
| 511 MT | 82.7 | 40.9 | 50.8 | 60.1 | 79.5 | 106.5 |
| 503 ST | 57.3 | 14.5 | 16.8 | 44.2 | 19.5 | 31.5 |
| 503 MT | 295.7 | 43.9 | 62.3 | 60.4 | 58.3 | 80.5 |
| Aztec High Off | 307fps | 56.8 | 69.8 | 266fps | 35 + 144 | 200.5 |
| Aztec+511MT | 92.0 | 119.8 | 78 + 142 | 256.5 | ||
Comparing the M1 Max against the competition, we resorted to Intel’s 11980HK on the MSI GE76 Raider. Unfortunately, we wanted to also do a comparison against AMD’s 5980HS, however our test machine is dead.
In single-threaded workloads, Apple’s showcases massive performance and power advantages against Intel’s best CPU. In CineBench, it’s one of the rare workloads where Apple’s cores lose out in performance for some reason, but this further widens the gap in terms of power usage, whereas the M1 Max only uses 8.7W, while a comparable figure on the 11980HK is 43.5W.
In other ST workloads, the M1 Max is more ahead in performance, or at least in a similar range. The performance/W difference here is around 2.5x to 3x in favour of Apple’s silicon.
In multi-threaded tests, the 11980HK is clearly allowed to go to much higher power levels than the M1 Max, reaching package power levels of 80W, for 105-110W active wall power, significantly more than what the MacBook Pro here is drawing. The performance levels of the M1 Max are significantly higher than the Intel chip here, due to the much better scalability of the cores. The perf/W differences here are 4-6x in favour of the M1 Max, all whilst posting significantly better performance, meaning the perf/W at ISO-perf would be even higher than this.
On the GPU side, the GE76 Raider comes with a GTX 3080 mobile. On Aztec High, this uses a total of 200W power for 266fps, while the M1 Max beats it at 307fps with just 70W wall active power. The package powers for the MSI system are reported at 35+144W.
Finally, the Intel and GeForce GPU go up to 256W power daw when used together, also more than double that of the MacBook Pro and its M1 Max SoC.
The 11980HK isn’t a very efficient chip, as we had noted it back in our May review, and AMD’s chips should fare quite a bit better in a comparison, however the Apple Silicon is likely still ahead by extremely comfortable margins.


493 Comments
View All Comments
Ppietra - Monday, October 25, 2021 - link
The number of transistors doesn’t say what is price because, like you said, they are not manufactured on the same node, nor even by the same company, so you have no idea what is the difference in yields for the manufacturing process used.Secondly the 3090 is actually much bigger than the M1 Max (630 mm^2 vs estimated 430 mm^2), and it’s the area that affects the yield per wafer on that node.
Thirdly you still have no idea what is the actual cost of the 3090 chip, so you don’t have a clue for the price of M1 Max to base your argument on.
sirmo - Monday, October 25, 2021 - link
TSMC discloses scaling between different nodes (84% better density from 7nm-5nm). So we have a pretty good idea. I am 100% sure M1 Max is more expensive to manufacture than 3090.Ppietra - Monday, October 25, 2021 - link
:S what are you talking about!??? We know the size of the 3090 and we already have an estimate for the M1 Max based on the size of M1. The 3090 is much much bigger.And it is not enough to be more expensive than the 3090, you actually need a very high cost value for your argument about subsidies to make any sense - and by the way you haven’t given any value that would make a case for it!
sirmo - Monday, October 25, 2021 - link
5nm is 84% denser than 7nm, and even more so compared to Samsung's 8nm. Which is why transistor count is easier to understand.Ppietra - Monday, October 25, 2021 - link
you continue to make no sense! What matters when talking about yields is die size. Transistors count doesn’t tell you anything about yields when comparing chips using different manufacturing processes.vlad42 - Monday, October 25, 2021 - link
The price per transistor has generally been on the rise since post 14nm. So, just because the 3090 is larger, that does not mean it is more expensive.Also, I would not say the M1 Max MacBook Pro is being sold at a loss, but I would bet that the upgrade cost from the M1 Pro is less than then cost difference between the two chips. That is to say, I think Apple's margins on the M1 Max MacBook Pro are less than the M1 Pro MacBook Pro (or the margins from the other extra components such as memory are making up for it).
valuearb - Tuesday, October 26, 2021 - link
The higher the price point the higher Apples margins are, that’s always been true. The margin on the $1999 14 inch M1 Pro MBP is always going to be less than margins on a $3500 16 inch M1 Max MBP.Think about it. It’s basic pricing strategy. The high end buyers aren’t as price sensitive, have higher disposable income, earn more from their MBP investment, etc.
Ppietra - Tuesday, October 26, 2021 - link
vlad42, never have I said that the 3090 is more expensive... my argument is that you cannot say that the M1 Max is more expensive just because it has more transistors - yields are affected by dye area which affects the price and there are other factors that affect price too. As for the price per transistor info, that is assuming the yield is always the same.They charge 400 dollars more just to upgrade to the M1 Max. Considering the size of the M1 Max that would give around 130 chips per wafer, the price per wafer should be around 17,000 dollars (according to some estimates). That would mean 130 dollars per chip at 100% yield. An extra 400 dollars should be more than enough to cover a low yields and packaging.
valuearb - Tuesday, October 26, 2021 - link
And Microsoft puts 15B transistors in a $500 gaming device. I’m thinking a $3,000 laptop has plenty of margin to cover those big wafers.valuearb - Tuesday, October 26, 2021 - link
Apple never sells at a loss, always prices for high margins, and has zero reason to change that now given the new MBPs were instantly back ordered. Underpricing would be leaving mass amounts of money on the table.