NVIDIA’s GeForce GTX Titan Review, Part 2: Titan's Performance Unveiled
by Ryan Smith & Rahul Garg on February 21, 2013 9:00 AM ESTTitan’s Compute Performance (aka Ph.D Lust)
Because GK110 is such a unique GPU from NVIDIA when it comes to compute, we’re going to shake things up a bit and take a look at compute performance first before jumping into our look at gaming performance.
On a personal note, one of the great things about working at AnandTech is all the people you get to work with. Anand himself is nothing short of fantastic, but what other review site also has a Brian Klug or a Jarred Walton? We have experts in a number of fields, and as a computer technology site that includes of course includes experts in computer science.
What I’m trying to say is that for the last week I’ve been having to fend off our CS guys, who upon hearing I had a GK110 card wanted one of their own. If you’ve ever wanted proof of just how big a deal GK110 is – and by extension Titan – you really don’t have to look too much farther than that.
Titan, its compute performance, and the possibilities it unlocks is a very big deal for researchers and other professionals that need every last drop of compute performance that they can get, for as cheap as they can get it. This is why on the compute front Titan stands alone; in NVIDIA’s consumer product lineup there’s nothing like it, and even AMD’s Tahiti based cards (7970, etc), while potent, are very different from GK110/Kepler in a number of ways. Titan essentially writes its own ticket here.
In any case, as this is the first GK110 product that we have had access to, we couldn’t help but run it through a battery of tests. The Tesla K20 series may have been out for a couple of months now, but at $3500 for the base K20 card, Titan is the first GK110 card many compute junkies are going to have real access to.
To that end I'd like to introduce our newest writer, Rahul Garg, who will be leading our look at Titan/GK110’s compute performance. Rahul is a Ph.D student specializing in the field of parallel computing and GPGPU technology, making him a prime candidate for taking a critical but nuanced look at what GK110 can do. You will be seeing more of Rahul in the future, but first and foremost he has a 7.1B transistor GPU to analyze. So let’s dive right in.
By: Rahul Garg
For compute performance, we first looked at two common benchmarks: GEMM (measures performance of dense matrix multiplication) and FFT (Fast Fourier Transform). These numerical operations are important in a variety of scientific fields. GEMM is highly parallel and typically compute heavy, and one of the first tests of performance and efficiency on any parallel architecture geared towards HPC workloads. FFT is typically memory bandwidth bound but, depending upon the architecture, can be influenced by inter-core communication bandwidth. Vendors and third-parties typically supply optimized libraries for these operations. For example, Intel supplies MKL for Intel processors (including Xeon Phi) and AMD supplies ACML and OpenCL-based libraries for their CPUs and GPUs respectively. Thus, these benchmarks measure the performance of the combination of both the hardware and software stack.
For GEMM, we tested the performance of NVIDIA's CUBLAS library supplied with CUDA SDK 5.0, on SGEMM (single-precision/fp32 GEMM) and DGEMM (double precision/fp64 GEMM) on square matrices of size 5k by 5k. For SGEMM on Titan, the data reported here was collected with boost disabled. We also conducted the experiments with boost enabled on Titan, but found that the performance was effectively equal to the non-boost case. We assume that it is because our test ran for a very short period of time and perhaps did not trigger boost. Therefore, for the sake of simpler analysis, we report the data with boost disabled on the Titan. If time permits, we may return to the boost issue in a future article for this benchmark.
Apart from the results collected by us for GTX Titan, GTX 680 and GTX 580, we refer to experiments conducted by Matsumoto, Nakasato and Sedukin reported in a technical report filed at the University of Aizu about GEMM on Radeon 7970. Their exact parameters and testbed are different than ours, and we include their results for illustrative purposes, as a ballpark estimate only. The results are below.
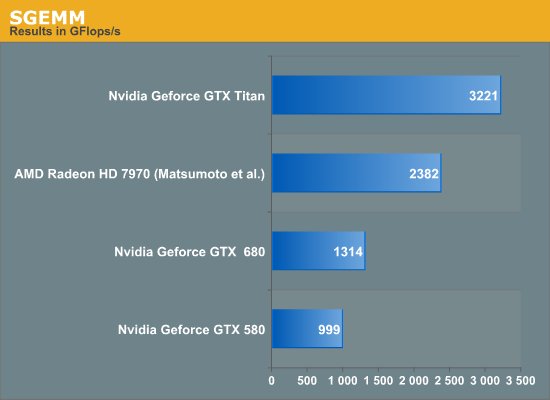
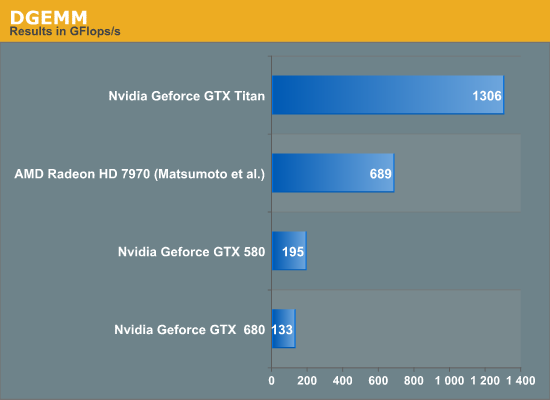
Titan rules the roost amongst the three listed cards in both SGEMM and DGEMM by a wide margin. We have not included Intel's Xeon Phi in this test, but the TItan's achieved performance is higher than the theoretical peak FLOPS of the current crop of Xeon Phi. Sharp-eyed readers will have observed that the Titan achieves about 1.3 teraflops on DGEMM, while the listed fp64 theoretical peak is also 1.3 TFlops; we were not expecting 100% of peak on the Titan in DGEMM. NVIDIA clarified that the fp64 rating for the Titan is a conservative estimate. At 837MHz, the calculated fp64 peak of Titan is 1.5 TFlops. However, under heavy load in fp64 mode, the card may underclock below the listed 837MHz to remain within the power and thermal specifications. Thus, fp64 ALU peak can vary between 1.3 TFlops and 1.5 TFlops and our DGEMM results are within expectations.
Next, we consider the percentage of fp32 peak achieved by the respective SGEMM implementations. These are plotted below.
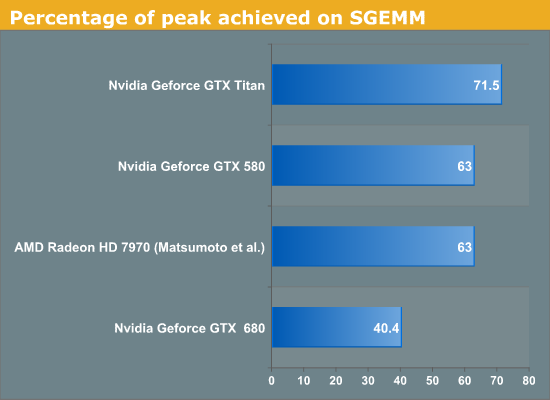
Titan achieves about 71% of its peak while GTX 680 only achieves about 40% of the peak. It is clear that while both GTX 680 and Titan are said to be Kepler architecture chips, Titan is not just a bigger GTX 680. Architectural tweaks have been made that enable it to reach much higher efficiency than the GTX 680 on at least some compute workloads. GCN based Radeon 7970 obtains about 63% of peak on SGEMM using Matsumoto et al. algorithm, and Fermi based GTX 580 also obtains about 63% of peak using CUBLAS.
For FFT, we tested the performance of 1D complex-to-complex inplace transforms of size 225 using the CUFFT library. Results are given below.
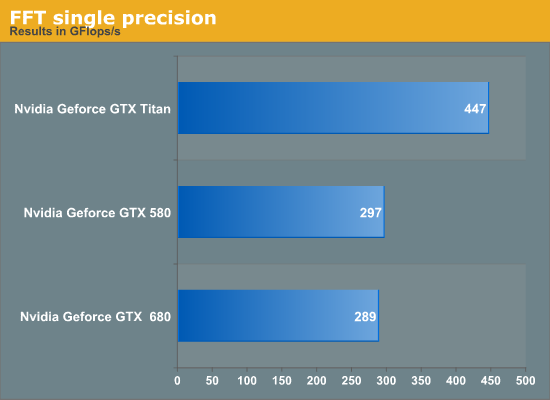
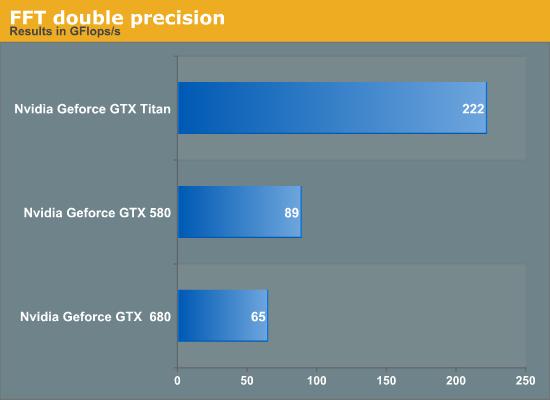
Titan outperforms the GTX 680 in FFT by about 50% in single-precision. We suspect this is primarily due to increased memory bandwidth on Titan compared to GTX 680 but we have not verified this hypothesis. GTX 580 has a slight lead over the GTX 680. Again, if time permits, we may return to the benchmark for a deeper analysis. Titan achieves about 3.4x the performance of GTX 680 but this is not surprising given the poor fp64 execution resources on the GTX 680.
We then looked at an in-house benchmark called SystemCompute, developed by our own Ian Cutress. The benchmark tests the performance on a variety of sample kernels that are representative of some scientific computing applications. Ian described the CPU version of these benchmarks in a previous article. Ian wrote the GPU version of the benchmarks in C++ AMP, which is a relatively new GPGPU API introduced by Microsoft in VS2012.
Microsoft's implementation of AMP compiles down to DirectCompute shaders. These are all single-precision benchmarks and should run on any DX11 capable GPU. The benchmarks include 2D and 3D finite difference solvers, 3d particle movement, n-body benchmark and a simple matrix multiplication algorithm. Boost is enabled on both the Titan and GTX 680 for this benchmark. We give the score reported by the benchmark for both cards, and report the speedup of the Titan over 680. Speedup greater than 1 implies Titan is faster, while less than 1 implies a slowdown.
| Benchmark | GTX 580 | GTX 680 | GTX Titan |
Speedup of Titan over GTX 680 |
| 2D FD | 9053 | 8445 | 12461 | 1.47 |
| 3D FD | 3133 | 3827 | 5263 | 1.37 |
| 3DPmo | 41722 | 26955 | 40397 | 1.49 |
| MatMul | 172 | 197 | 229 | 1.16 |
| nbody | 918 | 1517 | 2418 | 1.59 |
The benchmarks show between 16% and 60% improvement, with the most improvement coming from the relatively FLOP-heavy n-body benchmark. Interestingly, GTX 580 wins over the Titan in 3DPMo and wins over the 680 in 3DPmo and 2D.
Overall, GTX Titan is an impressive accelerator from compute perspective and posts large gains over its predecessors.


337 Comments
View All Comments
CeriseCogburn - Tuesday, February 26, 2013 - link
I really don't understand that mentality you have. I'm surrounded by thousands of dollars of computer parts and I certainly don't consider myself some sort of hardware enthusiast or addicted overclocker, or insane gamer.Yet this card is easily a consideration, since several other systems have far more than a thousand dollars in them on just the basics. It's very easy to spend a couple thousand even being careful.
I don't get what the big deal is. The current crop of top end cards before this are starkly inadequate at common monitor resolutions.
One must nearly ALWAYS turn down features in the popular benched games to be able to play.
People just don't seem to understand that I guess. I have untold thousands of dollars in many computers and the only thing that will make them really gaming capable at cheap monitor resolutions is a card like this.
Cripes my smartphone cost a lot more than the former top two cards just below Titan.
This is the one area that comes to mind ( the only one that exists as far as I can tell) where the user is left with "my modern computer can't do it" - and that means, take any current taxing game (lots of those - let's say 50% of those reviewed as a rough thumb) and you're stuck unable to crank it up.
Now 120hz monitors are becoming common, so this issue is increased.
As you may have noticed, another poster exclaimed:
" Finally ! 1920x1080 a card that can do it ! "
There's the flat out closest to the truth, and I agree with that entirely, at least for this moment, as I stated here before the 7970 didn't do it when it was released and doesn't now and won't ever. (neither does the 680)
I'm trying to deny it, but really it is already clear that the Titan doesn't cut it for everything at the above rez either, not really, and not at higher refresh rates.
More is still needed, and this is the spot that is lacking for gamers, the video card.
This card is the card to have, and it's not about bragging, it's about firing up your games and not being confronted with the depressing "turn off the eyecandy" and check the performance again... see if that is playable...
I mean ****, that apparently does not bother any of you, and I do not know why.
Everything else in your system is capable...
This is an IMPORTANT PART that actually completes the package, where the end user isn't compromising.
HighTech4US - Thursday, February 21, 2013 - link
If it does could we see a new story on performance using NVENC across the entire Kepler line along with any FREEware/PAYware software that utilizes it. I have an older Intel Q8300 that is used as my HTPC/Living Room Gaming System and encoding videos take a long time just using the CPU cores.If getting a Kepler GPU and using NVENC can speed up encoding significantly I would like to know. As that would be the lowest cost upgrade along with getting a Gaming card upgrade.
Thanks
Ryan Smith - Thursday, February 21, 2013 - link
Yes, NVEnc is present.lkuzmanov - Thursday, February 21, 2013 - link
excellent! now make it 30-40% cheaper and I'm on board.Zink - Thursday, February 21, 2013 - link
Rahul Garg picked the lowest HD 7970 scores in both cases from the Matsumoto et al. paper. The other higher GFLOPS scores represent performance using alternate kernels performing the same calculation on the same hardware as far as I can tell. Rahul needs to justify choosing only the lowest HD 7970 numbers in his report or I can only assume he is tilting the numbers in favor of Titan.JarredWalton - Thursday, February 21, 2013 - link
Picking the highest scoring results that are using optimized cores and running on different hardware in the first place (e.g. not the standard test bed) would be tilting the results very far in AMD's favor. A default run is basically what Titan gets to do, so the same for 7970 would make sense.codedivine - Thursday, February 21, 2013 - link
The different algorithms are actually not performing the exact same calculation. There are differences in matrix layouts and memory allocations. We chose the ones that are closest to the layouts and allocations we were testing on the Titan.In the future, we intend to test with AMD's official OpenCL BLAS. While Matsumoto's numbers are good for illustrative purposes. We would prefer running our own benchmarks on our own testbeds, and on real-world code which will typically use AMD's BLAS for AMD cards. AMD's OpenCL BLAS performance is actually a little bit lower than Matsumoto's numbers so I don't think we tilted the numbers in AMD's favour. If anything, we gave AMD a bit of benefit-of-the-doubt here.
In the same vein, faster results than Nvidia's CUBLAS have been demonstrated on Nvidia hardware. However, we chose to test only using CUBLAS as all production code will typically use CUBLAS due to its reliability and support from Nvidia.
AMD's OpenCL BLAS is a bit complicated to setup correctly and in my research, I have had problems with stability with it on Windows. Thus, we avoided it in this particular review but we will likely look at it in the future.
Zink - Thursday, February 21, 2013 - link
Thanks, shouldn't have doubted you :)Nfarce - Thursday, February 21, 2013 - link
...about my 680 purchase last April (nearly a year ago already, wow). Was so worried I made the wrong decision replacing two 570s knowing the Kepler was less than a year away. The news on this card has firmed up my decision to lock in with a second 680 now for moving up to a 2560x1440 monitor.Very *very* disappointing, Nvidia.
CeriseCogburn - Thursday, February 21, 2013 - link
The new top card has been near the same as two of the former cards FOREVER.You people are nothing short of stupid nut jobs.
There are not enough tampons at Johnson and Johnson warehouses for this thread.
THE VERY SAME RATIO has occurred every time for all the prior launches.