ARM A53/A57/T760 investigated - Samsung Galaxy Note 4 Exynos Review
by Andrei Frumusanu & Ryan Smith on February 10, 2015 7:30 AM ESTCortex A53 - Synthetic Performance
Usually big.LITTLE HMP designs have all their cores online and available to the system, and migrate a more demanding process to the big cores only when necessary. This poses a problem for us when trying to isolate the performance of the little cores.
Initially I was unable to turn off the cores via traditional methods such as simply hot-plugging the CPU cores, a method I used on Huawei's HiSilicon Kirin 920 for example. This caused a bit of a headache and I had to circumvent this by taking advantage of the Global Task Scheduling parameters of the kernel to block off any processes migrating over to the big cluster and enabling forceful down-migration on any entity that is forked on the big CPUs.
Later on, I finally found which mechanism was preventing me from turning off the cores properly - one of Samsung's own power management drivers that serves to hot plug cores when turning the screen off was keeping me from turning a CPU off while the screen was on. I disabled this driver at a later date after doing the performance and initial power measurement, and I re-verified and checked that my numbers were still valid, which luckily they were.
For starters, we turn to SPECint2000. Developed by the Standard Performance Evaluation Corporation, SPECint2000 is the integer component of their larger SPEC CPU2000 benchmark. Designed around the turn of the century, officially SPEC CPU2000 has been retired for PC processors, but mobile processors are roughly a decade behind their PC counterparts in performance. Keeping that in mind it still provides an excellent benchmark for today's mobile phones and allows us to do single-threaded architectural comparisons between the competing CPU designs out there.
I'd also like to mention that we're still working with an ARMv7 version of the benchmark and thus it doesn't fully take advantage of the Exynos 5433's ARMv8 cores, even though it's limited to AArch32 by software for now.
| SPECint2000 - Estimated Scores | ||||||
| Exynos 5430 (A7) |
Exynos 5433 (A53) |
% Advantage | ||||
| 164.gzip | 686 | 814 | 19% | |||
| 175.vpr | 292 | 272 | -7% | |||
| 176.gcc | 431 | 597 | 39% | |||
| 177.mesa | 505 | 633 | 25% | |||
| 179.art | 225 | 523 | 132% | |||
| 181.mcf | 202 | 291 | 44% | |||
| 186.crafty | 342 | 448 | 31% | |||
| 197.parser | 321 | 348 | 8% | |||
| 252.eon | 677 | 935 | 38% | |||
| 253.perlbmk | 393 | 529 | 35% | |||
| 254.gap | 395 | 544 | 38% | |||
| 255.vortex | 427 | 529 | 24% | |||
| 256.bzip2 | 344 | 362 | 5% | |||
| 300.twolf | 302 | 284 | -6% | |||
We're comparing the A7 in the Exynos 5430 versus the A53 in the Exynos 5433. Here we see an overall increase of 30% for the A53 cores. Both SoCs run the little clusters at the same frequency and thus it gives us a direct IPC comparison between the two architectures.
The biggest outlier here is the ART test, which is an image recognition / neural network workload that tests floating point rather than integer performance. There are also drops in performance on the VPR and TWOLF tests, which may be running into the L2 cache performance issues discussed on the previous page.
Our other synthetic performance benchmark is GeekBench 3. Here we're able to take advantage of at least the AArch32 mode of the CPU, which has a big impact on the crypto scores:
| GeekBench 3 - Integer Performance | ||||||
| A7 (ARMv7) | A53 (AArch32) | % Advantage | ||||
| AES ST | 23.1 MB/s | 662 MB/s | 1865% | |||
| AES MT | 89.4 MB/s | 2570 MB/s | 1874% | |||
| Twofish ST | 26.9 MB/s | 45.9 MB/s | 70% | |||
| Twofish MT | 101.8 MB/s | 277.2 MB/s | 172% | |||
| SHA1 ST | 53.9 MB/s | 281.2 MB/s | 421% | |||
| SHA1 MT | 210.8 MB/s | 1880 MB/s | 791% | |||
| SHA2 ST | 30.1 MB/s | 69.6 MB/s | 131% | |||
| SHA2 MT | 115.8 MB/ | 330.6 MB/s | 185% | |||
| BZip2Comp ST | 1.95 MB/s | 2.09 MB/s | 7% | |||
| BZip2Comp MT | 5.52 MB/s | 11.7 MB/s | 111% | |||
| Bzip2Decomp ST | 2.83 MB/ | 3.24 MB/s | 14% | |||
| Bzip2Decomp MT | 7.41 MB/s | 14.0 MB/s | 89% | |||
| JPG Comp ST | 6.84 MP/s | 9.95 MPs | 45% | |||
| JPG Comp MT | 26.2 MP/s | 59.5 MP/s | 127% | |||
| JPG Decomp ST | 11.4 MP/s | 14.3 MP/s | 25% | |||
| JPG Decomp MT | 43.1 MP/s | 72.0 MP/s | 67% | |||
| PNG Comp ST | 0.51 MP/s | 0.591 MP/s | 16% | |||
| PNG Comp MT | 1.28 MP/s | 2.49 MP/s | 94% | |||
| PNG Decomp ST | 7.35 MP/s | 9.68 MP/s | 31% | |||
| PNG Decomp MT | 25.2 MPs | 39.2 MP/s | 55% | |||
| Sobel ST | 18.2 MP/s | 22.0 MP/s | 21% | |||
| Sobel MT | 67.7 MP/s | 103.8 MP/s | 53% | |||
| Lua ST | 0.469 MB/s | 0.579 MB/s | 23% | |||
| Lua MT | 1.42 MB/s | 1.75 MB/s | 23% | |||
| Dijkstra ST | 2.31 Mpairs/s | 2.84 Mpairs/s | 23% | |||
| Dijkstra MT | 6.7 Mpairs/s | 11 Mpairs/s | 64% | |||
Due to new cryptographic instructions in the ARMv8 ISA we see huge improvements in the AES and SHA tests, not too different from the increase we saw when Apple introduced the A7 in the iPhone 5S. However, if we disregard the crypto benchmarks, we see a more reasonable but still very impressive average improvement of 49% across the rest of the benchmarks. Only the BZip compression and decompression tests show only minor improvement in their single-threaded runs, which oddly enough were not reproduced in the multi-threaded runs.
| GeekBench 3 - Floating Point Performance | ||||||
| A7 (ARMv7) | A53 (AArch32) | % Advantage | ||||
| BlackScholes ST | 1.68 Mnodes/s | 2.12 Mnodes/s | 26% | |||
| BlackScholes MT | 6.53 Mnodes/s | 12.9Mnodes/s | 97% | |||
| Mandelbrot ST | 448.6 MFLOPS | 519.7 MFLOPS | 15% | |||
| Mandelbrot MT | 1.75 GFLOPS | 3.44 GFLOPS | 96% | |||
| Sharpen Filter ST | 305.5 MFLOPS | 607.2MFLOPS | 99% | |||
| Sharpen Filter MT | 1.17 GFLOPS | 2.69 GFLOPS | 129% | |||
| Blur Filter ST | 0.365 GFLOPS | 0.488 GFLOPS | 33% | |||
| Blur Filter MT | 1.44 GFLOPS | 2.95 GFLOPS | 11% | |||
| SGEMM ST | 0.601 GFLOPS | 0.577 GFLOPS | 104% | |||
| SGEMM MT | 0.869 GFLOPS | 3.78 GFLOPS | 339% | |||
| DGEMM ST | 0.234 GFLOPS | 0.239 GFLOPS | 2% | |||
| DGEMM MT | 0.578 GFLOPS | 2.52 GFLOPS | 342% | |||
| SFFT ST | 0.318 GFLOPS | 1.22 GFLOPS | 283% | |||
| SFFT MT | 1.27 GFLOPS | 4.89 GFLOPS | 285% | |||
| DFFT ST | 215.3 MFLOPS | 919.8 MFLOPS | 327% | |||
| DFFT MT | 0.758 GFLOPS | 3.01 GFLOPS | 297% | |||
| N-Body ST | 147.1 Kpairs/s | 381.4 Kpairs/s | 159% | |||
| N-Body MT | 0.504 Mpairs/s | 1.54 Mpairs/s | 205% | |||
| Ray Trace ST | 0.598 MP/s | 1.72 MP/s | 187% | |||
| Ray Trace MT | 2.30 MP/s | 7.24 MP/s | 214% | |||
In the floating point performance benchmarks we again see massive improvements, with many scores being twice or even three times the performance of the A7. Again there's a peculiarity in that the multi-threaded scores show a higher improvement over the A7 than the single-threaded tests.
Power Consumption
Testing out power consumption on the little cores was a bit tricky as I needed to remain on the little clusters without spilling over four threads that might wake up the big cores. For this, I use hot-plugging to disable the cores that we're not measuring directly to avoid any power overhead caused by unwanted activity that might occur on the big cluster.
To get to these figures, I derived the power numbers by measuring total energy consumption during each test for a 1 minute period and repeated this several times to ensure the accuracy of the numbers. Power of the screen has also been subtracted via the same methodology and verified that it is accurate enough to give a pure representation of the load power of the SoC only. On both devices the GPU and display pipeline are power-gated and as such the load power should consist primarily of the regulator overheads, CPU cores, L2 caches, system memory and interconnect bus interfaces.
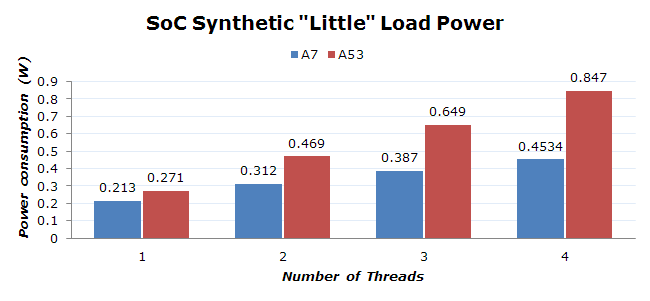
When loading a various number of threads on the little cluster we see some interesting numbers when comparing the 5430 to the 5433. First of all, it's obvious that the A53 is more power hungry than the A7. The surprise is that this factor seems to be quite big. For the A7, we see a base 213mW system load power when firing up one thread, with decreasing increments for each additional thread. We see 99, 75, and 66 mW additional power for the added threads.
I'm not quite sure why the numbers are diminishing here - I first thought that the scheduler would've been fast enough to try to fill the cores' capacity causing each additional core to have more idle time to itself since we're targeting a 96% load per thread. But that's not the case, as each thread was on its own core and the load was evenly distributed.
Looking at the A53, we see a similar story but with inflated figures. The base 271mW load power with one thread is a tad higher for the new ARMv8 cores than for the A7, and that difference gets bigger with each additional thread we run.
Initially I had tested these figures without shutting down the cores individually, and used the HMP scheduler controls to isolate the big cluster, which led me to the further investigations in the scheduler. It seems that the current GTS implementation delivered on these devices is still lacking a feature called "Small Task Packing". Small task packing allows the scheduler to try and pack low-load tasks onto an already woken up CPU core instead of spreading the load throughout the cores of the cluster.
In case of the current big.LITTLE implementations, spreading loads throughout the cluster is a disadvantageous strategy as it forces cores to come out of their independent power collapse states on a frequent basis. I'm not sure if that's why we're seeing diminishing power consumption numbers with increased thread count; the low-thread power numbers may be inflated by rogue idle wake-ups on the what should have been remaining idle cores. This delta decreases as we increase thread count and thus CPUs which are awake, so this would be a sensible explanation of the effect.
To verify this I re-ran a full power analysis on the full frequency curve of the CPU while isolating the cores via hot plugging. This should avoid any incorrect measurements that would have occurred by the other method.
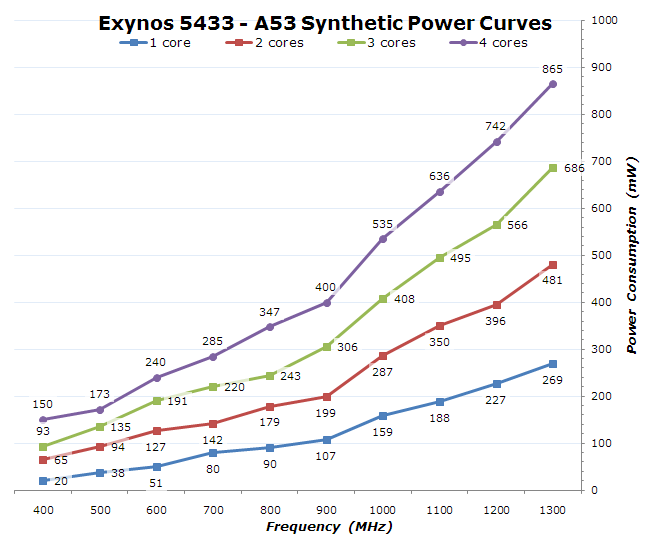
The effect is repeated here too, but only the highest frequency of the A53, it was harder to notice on the lower frequencies. The interesting thing about the curves to notice is that power goes up by a relatively large amount after the 1GHz P-state. This also correlates with a higher voltage bump from 962.5mV on the 900MHz state to 1025mV and up at higher frequencies.
What we're left with is a rough estimate of per-core power load for both the A7 and the A53 at their highest frequencies of 1300MHz. I calculated this number by trying to account for the cluster power overhead and just look at the power of the cores themselves:
| Estimated Little Per-Core Power Consumption | |||
| A7 (Exynos 5430) | A53 (Exynos 5433) | Increase | |
| Little per-core load | ~85mW | ~189mW | 122% |
I think it's safe to say the A53 consumes a little over twice the power of an A7 core given almost the same SoC platform. This seems a lot given the actual performance increase is much less than that; it would mean that the performance/Watt (perf/W) has actually gone down with the A53. We also have to keep in mind that the A53 adds a lot of new silicon to the die, so let's look at the block sizes between the A7 and the A53:
| A7 vs A57 Block Sizes | ||||
| A7 (Exynos 5430) | A53 (Exynos 5433) | Scaling Factor | ||
| Core | 0.40mm² | 0.70mm² | 1.75 | |
| Cluster | 3.30mm² | 4.58mm² | 1.38 | |
While still maintaining rather minuscule core sizes of under 1mm², the A53 is still 1.75 times bigger than an A7 core on the same process node. The total cluster size difference comes in at a lesser 1.38x factor, but that is because the cache sizes have remained the same between the two implementations.
To try to actually measure a realistic and real-world scenario of perf/W, I tried hard to find a good test-load. After some searching around and trying out various items from our benchmark suite, I ended up focusing on BaseMark OS II's XML sub-test. The test is a good candidate because it offers a scaling load with three threads that put both a high load on some cores and let others exercise their power management states at the same time, definitely behavior you would see in day-to-day applications.
| BaseMark OS II - XML Parsing Energy Efficiency | ||||
| Performance | Energy | Performance/Energy | ||
| A7 (Exynos 5430) | 77.93MB/s | 10.56mWh | ~7.38 | |
| A53 (Exynos 5433) | 109.36MB/s | 17.11mWh | ~6.39 | |
Indeed we see that the A53 is able to achieve greater performance than the A7, but at a greater added cost of energy than the performance increase itself. The effect is that the overall perf/W went down by 15% in this particular test. This is an interesting metric as it validates the continued existence of standalone A7 SoCs over A53 designs, with the new A53 cores being something like an extension to the perf/W curve.
All in call, I think ARM made the right choices here with the A53. The performance increases were definitely needed - not only for standalone SoCs which rely solely on the A53, but also for big.LITTLE SoCs. What I hope to see in the future is more aggressively clocked A53 implementations going beyond the 1.5-1.7GHz that we currently see as the upper limits in SoCs such as the Snapdragon 810 and the Snapdragon 615. The question is whether clock increases and coming upgrades to the memory systems such as the introduction of LPDDR4 memory next year will be enough to keep the core competitive. I certainly hope, and think so.
While we have a good impression of the A53 cores, actual high-end performance is delivered by the A57 cores. So let's have a look and repeat our exercise for the A57.


135 Comments
View All Comments
gijames1225 - Tuesday, February 10, 2015 - link
Why do you say that? This seems highly comparable in benchmarks, and it's not even running a 64bit OS yet. I'd guess that after they update it to Lollipop it's equal to the A8 overall, which is really impressive given they're generic cores from ARM.arsjum - Tuesday, February 10, 2015 - link
I don't think bigstrudel actually read the article before leaving that comment.Stuka87 - Tuesday, February 10, 2015 - link
But it does take them twice as many cores, higher clock speed, and triple the ram to match the A8. I am not sure Apple is years ahead, but they certainly have an edge, which is most likely a result of designing the software that runs on the hardware. They are able to make efficiency improvement android handset makers just aren't able to do.Alexey291 - Tuesday, February 10, 2015 - link
That's called optimising and that was actually something derided by the author in the article (browser optimisations for the platform are apparently a bad thing now - talk about throwing out the baby with the bathwater)Andrei Frumusanu - Tuesday, February 10, 2015 - link
I think you misunderstood my point of view, I'm all for optimizations and hope vendors continue it, and even encourage it. I was just pointing out that it negatively affects our benchmarking methodology as Chrome continues to fall behind.bigstrudel - Tuesday, February 10, 2015 - link
Chrome isn't falling behind in real-world load times.Only in tampered with benchmark results like Samsung's "optimized" Stock Browser. Benchmarks show performance gains for Samsung's browser vs Chrome on the order of twice the performance? It makes me chuckle to see Samsung also only cheats the results enough to equal the iPhone 6.
Give me a break. Anyone with half-a-brain knows whats up here.
hung2900 - Tuesday, February 10, 2015 - link
Bigstrudel, how big is your brain? A quarter?Browser optimization is cheating? So hilarious. Did you spend a little bit of time to read the Browser benchmark part? Or just your brain cannot process?
Kidster3001 - Friday, February 27, 2015 - link
Samsung's custom browser is a tweaked version of chrome. It's just optimizing for the platform. Not only commendable but something that should be the norm.bigstrudel - Tuesday, February 10, 2015 - link
4 times the cores. Much higher clock speed and it still lags behind A8 overall.Easy to understand which one is more advanced based on that set of facts.
DarkLeviathan - Saturday, December 19, 2015 - link
lol true. but i never thought about it that way haha