The Silicon Motion SM2262EN SSD Controller Preview: Good And Bad Amplified
by Billy Tallis on August 1, 2018 11:45 AM ESTAnandTech Storage Bench - Heavy
Our Heavy storage benchmark is proportionally more write-heavy than The Destroyer, but much shorter overall. The total writes in the Heavy test aren't enough to fill the drive, so performance never drops down to steady state. This test is far more representative of a power user's day to day usage, and is heavily influenced by the drive's peak performance. The Heavy workload test details can be found here. This test is run twice, once on a freshly erased drive and once after filling the drive with sequential writes.
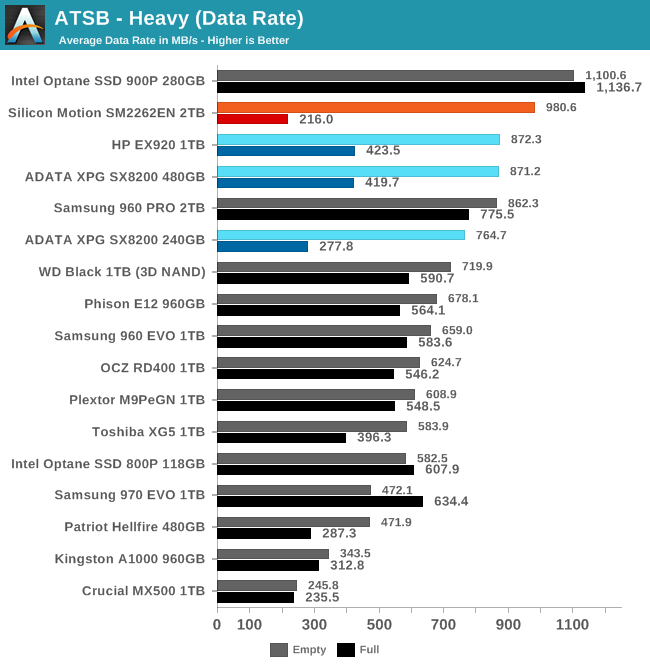
The SM2262EN improves on the SM2262's already class-leading performance on the Heavy test, with an average data rate that is about 12% higher. However, this comes at the cost of reduced performance when the test is run on a full drive—and that was already the biggest weakness of the SM2262 drives.
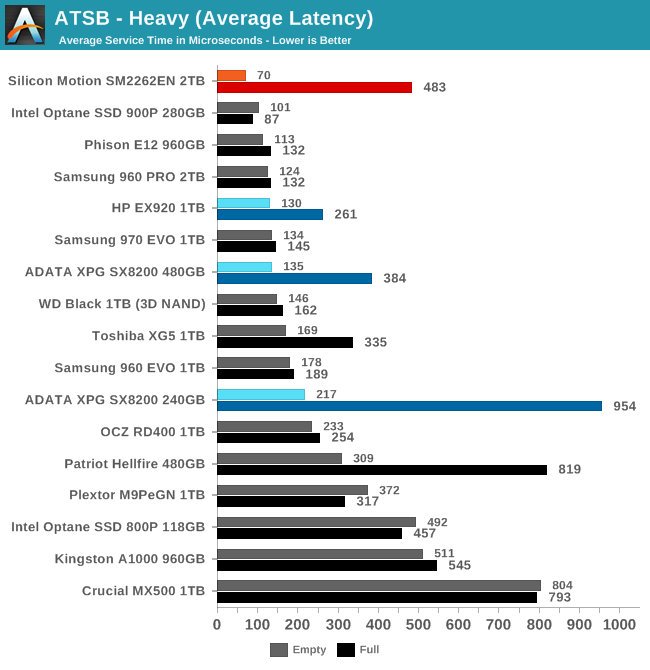
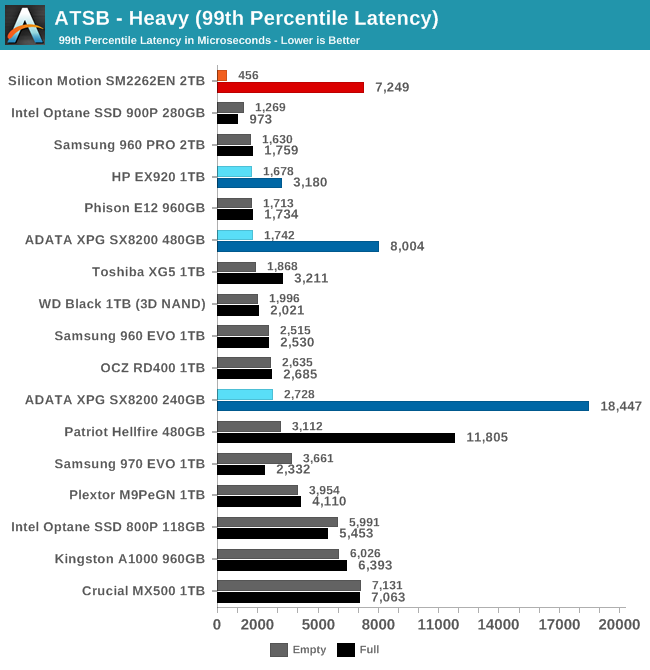
The average and 99th percentile latencies show an even more stark dichotomy in the SM2262EN's performance characteristics. When the Heavy test is run on a freshly-erased drive, the latency is impressively low and the 99th percentile QoS score is unprecedented. But when the drive fills up, it completely leaves the high-end performance bracket.
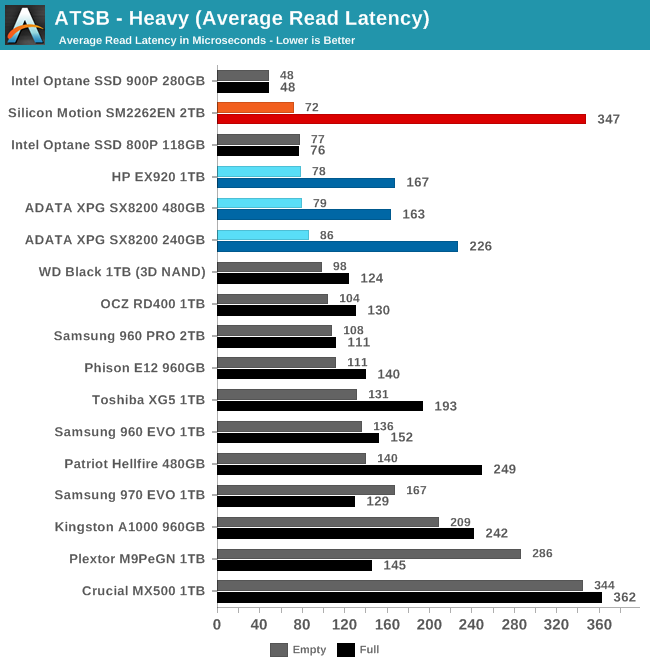
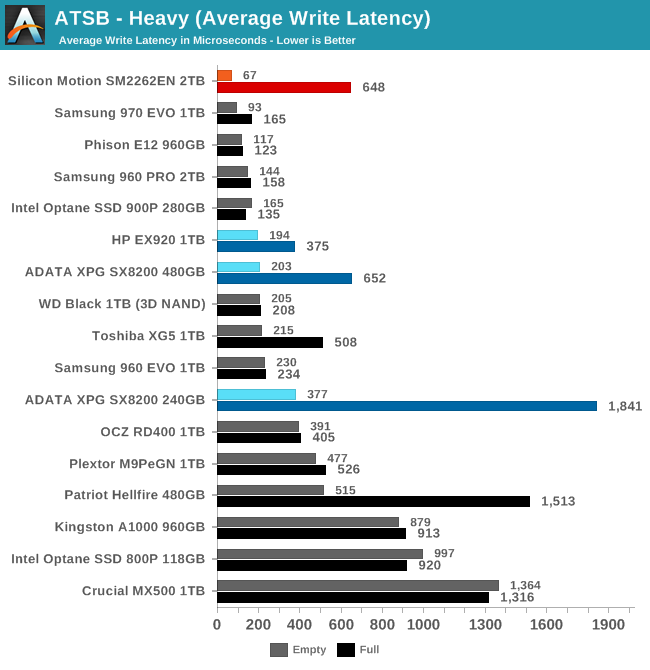
Under favorable conditions, the SM2262EN manages to beat the average read latency of the slower Optane SSD, and it offers the top-notch average write latency that the SM2262 drives couldn't quite manage. But when the drive is full, read latency gets pushed to SATA levels and write latency increases by an order of magnitude.
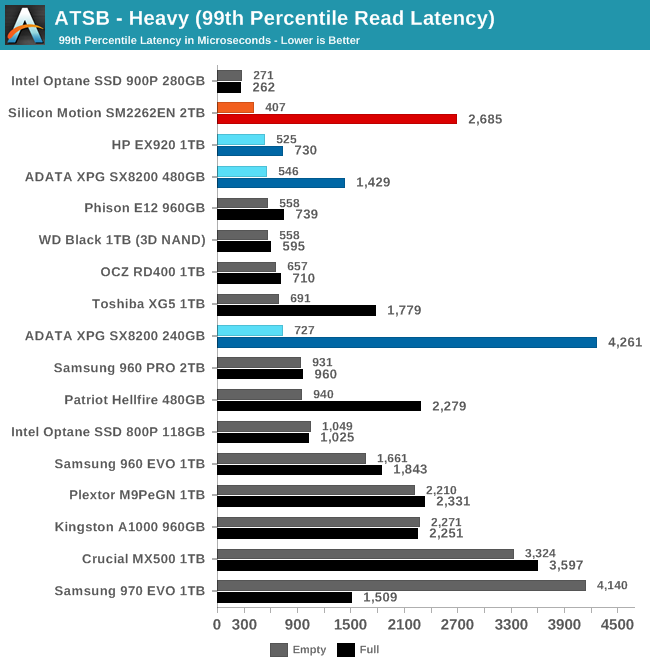
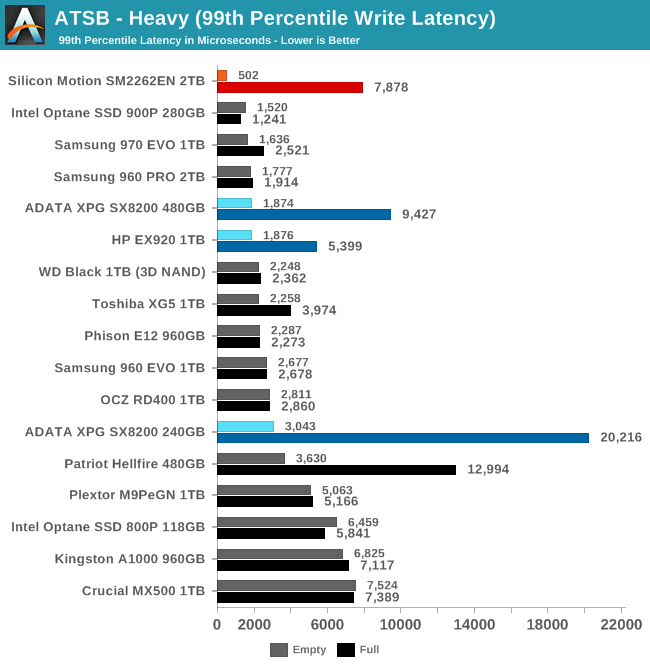
The 99th percentile write latency of the SM2262EN when the Heavy test is run on a freshly-erased drive is less than a third that of any other drive, and the 99th percentile read latency is second only to the Optane SSD 900P. When this drive has plenty of spare area and SLC cache space, it's extremely fast. But fill it up and we're back to low-end NVMe performance that's considerably worse than the 1TB HP EX920.
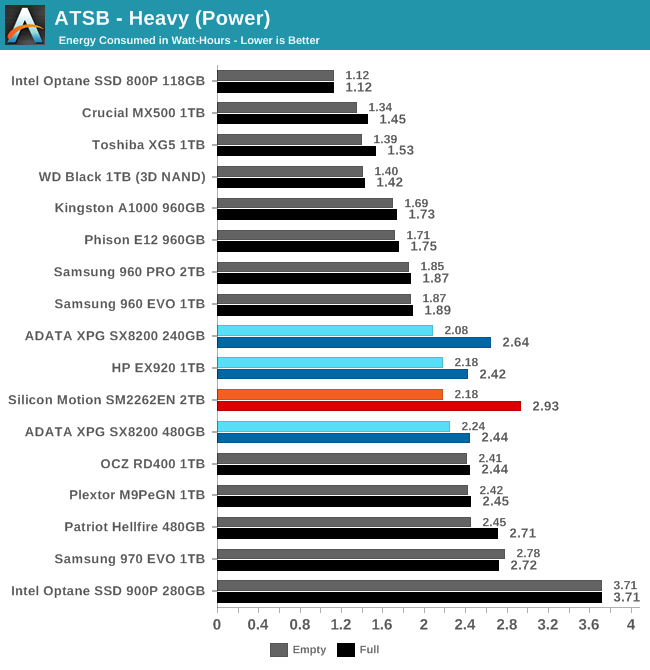
Energy usage by the SM2262EN drive on the Heavy test is comparable to the SM2262 drives, but with a much bigger disparity between the empty and full drive test runs. Even without the full-drive problems, this wouldn't be the best choice for a laptop.


28 Comments
View All Comments
DigitalFreak - Wednesday, August 1, 2018 - link
One thing has always confused me about these benchmarks. Does performance get progressively worse as the drive fills up? For example, the ATSB - Light average latency for the drive is 48 mu empty and 330 mu full. Does that mean when the drive is 50% full the latency would be around 189 mu? Or does it run at 48 mu until the drive hits 100% full? Same for the average data rate.Billy Tallis - Wednesday, August 1, 2018 - link
I think there's usually a threshold at which performance drops pretty rapidly because the SLC cache or spare area is no longer large enough. Unfortunately, determining the shape of the curve and where the threshold is (if there is one) is extremely time-consuming, and the tools used for the ATSB tests don't make it easy to test multiple drives in parallel.I did run the Heavy and Light tests on this drive with it 80% full and the results were similar to the 100% full case. But manual overprovisioning like that doesn't necessarily have the same impact that re-tuning the firmware would. A typical variable-size SLC cache won't be significantly larger for an 80% full drive than for a 100% full drive.
And there's still the problem that the ATSB tests don't give the drive any long idle periods to flush the SLC cache. The SLC cache on a full drive might be large enough to handle the Heavy test reasonably well if it gets a realistic amount of idle time to flush the cache mid-test. But that would take the Heavy test from 1.5 hours to a full day.
DigitalFreak - Wednesday, August 1, 2018 - link
Understandable. With the huge performance difference between empty and full with this controller, I was just curious at what percentage used the drive performance tanked. Based on your test we already know that 80% full is just as bad as 100%. Hopefully it's not any lower than that.justaviking - Wednesday, August 1, 2018 - link
I had the exact same question. How full is full?If the performance hit did not occur until 95% full or more, then it would be easily avoidable and acceptable (to me). If it happens at 30% full, it's a deal breaker. Or a linear degredation would also unacceptable to me since the degredation is so extreme.
I STRONGLY ENCOURAGE taking the time to explore the "degradation curve" relative to "fullness" for this drive, since it is so dramatic. It could make a special article of the type AnandTech excels at.
29a - Wednesday, August 1, 2018 - link
I agree.jtd871 - Wednesday, August 1, 2018 - link
How long of a "long idle time" do you need? Are you talking about 1.5h run time for ATSB to 8h or 24h with sufficiently long "long idle times"?Billy Tallis - Wednesday, August 1, 2018 - link
Currently, the ATSB tests cut all idle times down to a maximum of 25ms. I suspect that idle times on the order of seconds would be sufficient, but I don't think we even still have the original traces with the full idle times. In the near future I'll do some SYSmark runs with a mostly-full drive; that's a similar intensity of storage workload to the ATSB light, but with a fairly realistic pacing including idle.I'll also try to compare the power data against the performance test duration for the synthetic tests. That should reveal how long the drive took to return to idle after the writing stopped, and give us a pretty good idea of how quickly the drive can empty the SLC cache and how high of a duty cycle it can sustain for writes at full speed.
Dark_wizzie - Wednesday, August 1, 2018 - link
A larger drive helps mitigate the issues because 1) Larger drives tend to have large SLC cache? Or 2) There is more normal free space for the drive?Billy Tallis - Wednesday, August 1, 2018 - link
Both, in a big way when it's 2TB, and especially when you have a variable-size SLC cache. A mostly-empty 2TB drive can have over 100GB of SLC cache, which is absolutely impossible to fill up with any real-world client workload.mattrparks - Wednesday, August 1, 2018 - link
I wonder if...I think you could get similar results (stellar performance characteristics at low drive usage) by using a larger DRAM read/write cache when the drive mapping table is not taking up as much RAM. With 2GB of DDR4, let's say arbitrarily that 1.5GB of that is used by FTL page mapping tables when the drive is full. What if you found a way in firmware to manage your memory such that when most of the drive FTL is unmapped, that you could use say only 0.5GB for the mapping table and have an extra 1GB available for caching? Many of the synthetic tests could be gamed by keeping that much drive cache. I don't remember your drive testing methodology fully, but perhaps a full power cycle of the drive after the data is written, before the read tests, would make sure that all the performance is indeed SLC speed and not just enormous amounts of caching.