The Zotac ZBOX CI660 nano Fanless mini-PC Review: A Promising HTPC Platform
by Ganesh T S on April 16, 2019 8:15 AM ESTUL Benchmarks - PCMark and 3DMark
This section deals with a selection of the UL Futuremark benchmarks - PCMark 10, PCMark 8, and 3DMark. While the first two evaluate the system as a whole, 3DMark focuses on the graphics capabilities.
PCMark 10
UL's PCMark 10 evaluates computing systems for various usage scenarios (generic / essential tasks such as web browsing and starting up applications, productivity tasks such as editing spreadsheets and documents, gaming, and digital content creation). We benchmarked select PCs with the PCMark 10 Extended profile and recorded the scores for various scenarios. These scores are heavily influenced by the CPU and GPU in the system, though the RAM and storage device also play a part. The power plan was set to Balanced for all the PCs while processing the PCMark 10 benchmark.
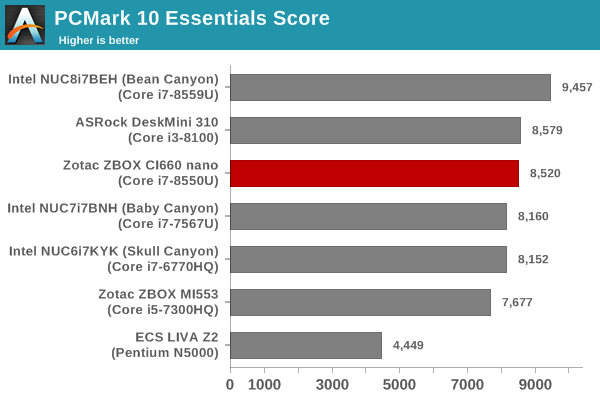
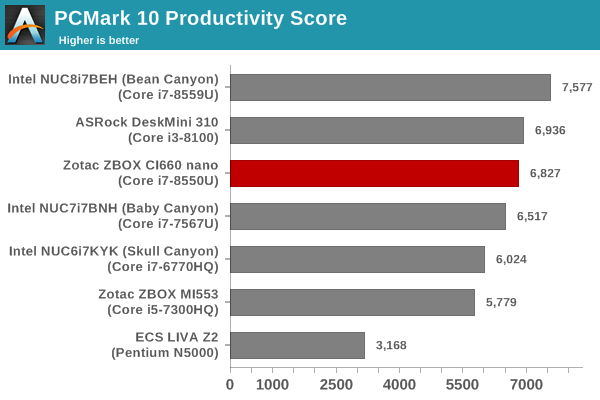
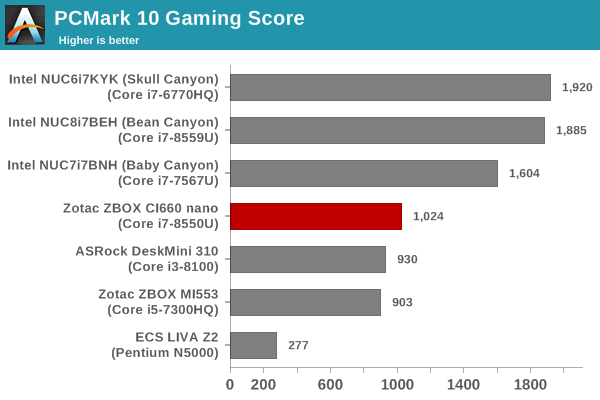
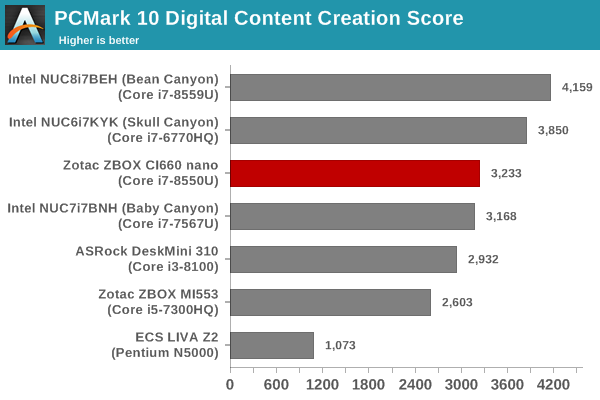
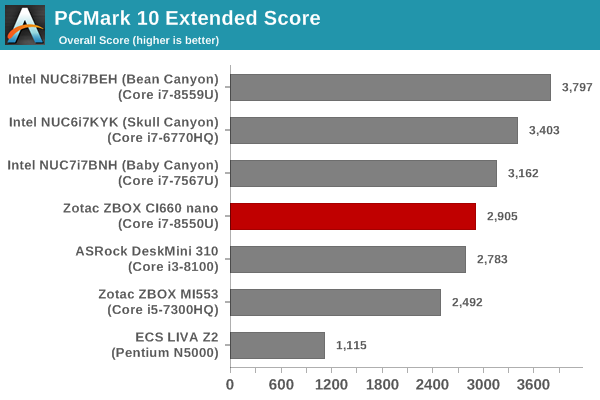
The relative numbers are very similar to the SYSmark 2018 results for those specific workloads. However, some expected weaknesses start showing up in the GPU-dependent workloads such as gaming and digital content creation.
PCMark 8
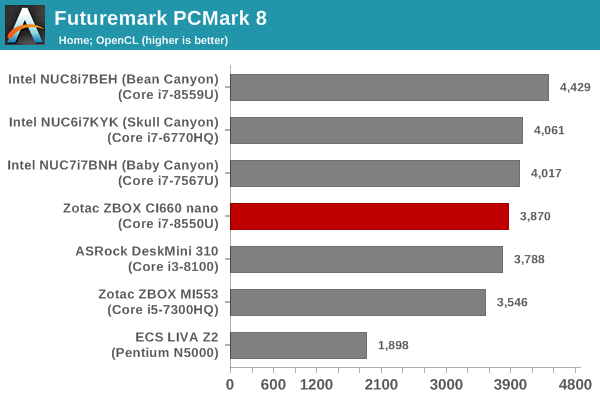
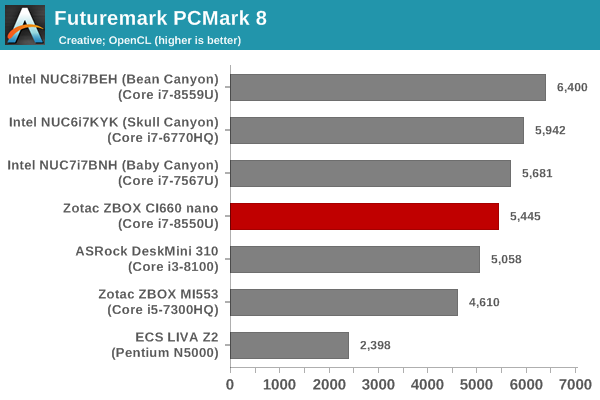
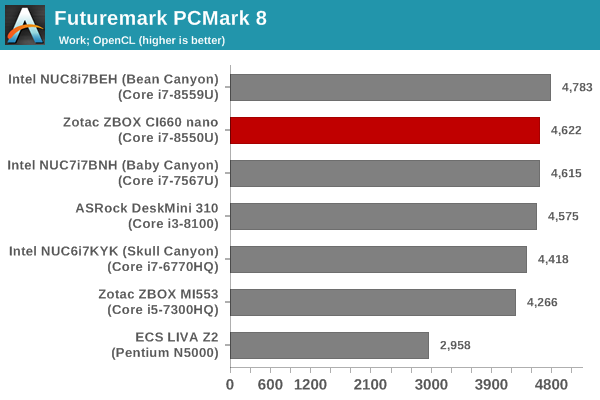
We continue to present PCMark 8 benchmark results (as those have more comparison points) while our PCMark 10 scores database for systems grows in size. PCMark 8 provides various usage scenarios (home, creative and work) and offers ways to benchmark both baseline (CPU-only) as well as OpenCL accelerated (CPU + GPU) performance. We benchmarked select PCs for the OpenCL accelerated performance in all three usage scenarios. These scores are heavily influenced by the CPU in the system. The NUCs show consistently higher performance, except for the Work scenario, where only the Bean Canyon NUC configuration surpasses the CI660 nano.
3DMark
UL's 3DMark comes with a diverse set of graphics workloads that target different Direct3D feature levels. Correspondingly, the rendering resolutions are also different. We use 3DMark 2.4.4264 to get an idea of the graphics capabilities of the system. In this section, we take a look at the performance of the Zotac ZBOX CI660 nano across the different 3DMark workloads.
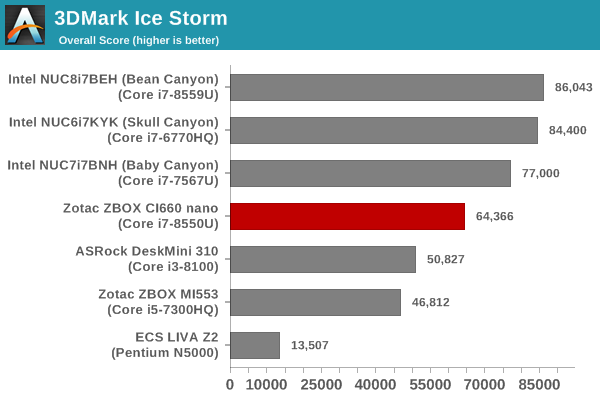
3DMark Ice Storm
This workload has three levels of varying complexity - the vanilla Ice Storm, Ice Storm Unlimited, and Ice Storm Extreme. It is a cross-platform benchmark (which means that the scores can be compared across different tablets and smartphones as well). All three use DirectX 11 (feature level 9) / OpenGL ES 2.0. While the Extreme renders at 1920 x 1080, the other two render at 1280 x 720. The graphs below present the various Ice Storm worloads' numbers for different systems that we have evaluated.
| UL 3DMark - Ice Storm Workloads | |||
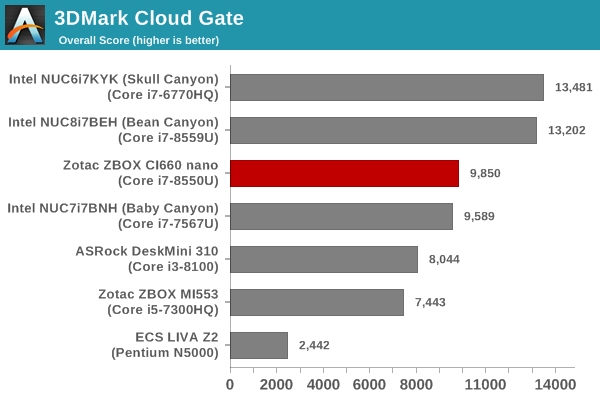
3DMark Cloud Gate
The Cloud Gate workload is meant for notebooks and typical home PCs, and uses DirectX 11 (feature level 10) to render frames at 1280 x 720. The graph below presents the overall score for the workload across all the systems that are being compared.
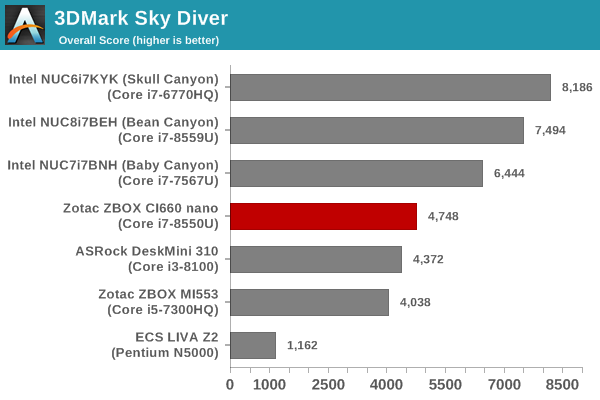
3DMark Sky Diver
The Sky Diver workload is meant for gaming notebooks and mid-range PCs, and uses DirectX 11 (feature level 11) to render frames at 1920 x 1080. The graph below presents the overall score for the workload across all the systems that are being compared.
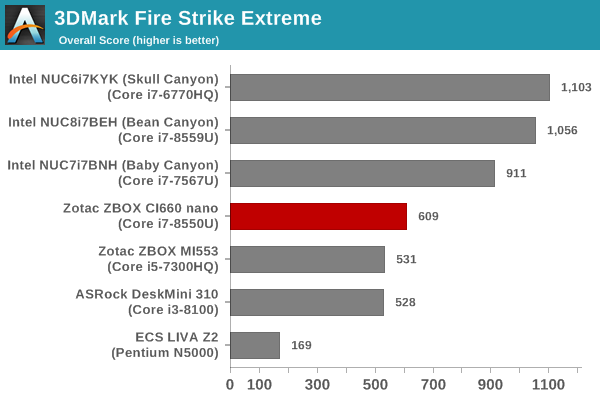
3DMark Fire Strike Extreme
The Fire Strike benchmark has three workloads. The base version is meant for high-performance gaming PCs. Similar to Sky Diver, it uses DirectX 11 (feature level 11) to render frames at 1920 x 1080. The Ultra version targets 4K gaming system, and renders at 3840 x 2160. However, we only deal with the Extreme version in our benchmarking - It renders at 2560 x 1440, and targets multi-GPU systems and overclocked PCs. The graph below presents the overall score for the Fire Strike Extreme benchmark across all the systems that are being compared.
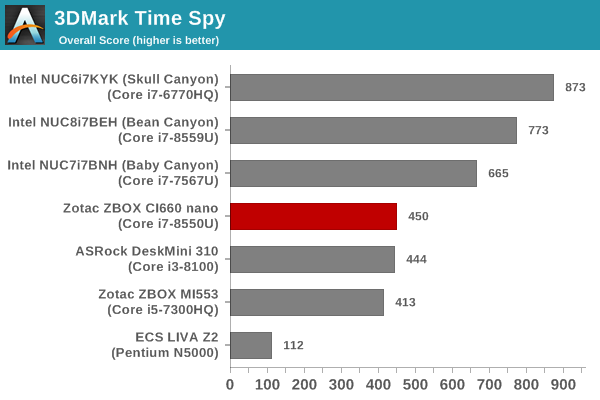
3DMark Time Spy
The Time Spy workload has two levels with different complexities. Both use DirectX 12 (feature level 11). However, the plain version targets high-performance gaming PCs with a 2560 x 1440 render resolution, while the Extreme version renders at 3840 x 2160 resolution. The graphs below present both numbers for all the systems that are being compared in this review.
| UL 3DMark - Time Spy Workloads | |||
3DMark Night Raid
The Night Raid workload is a DirectX 12 benchmark test. It is less demanding than Time Spy, and is optimized for integrated graphics. The graph below presents the overall score in this workload for different system configurations.
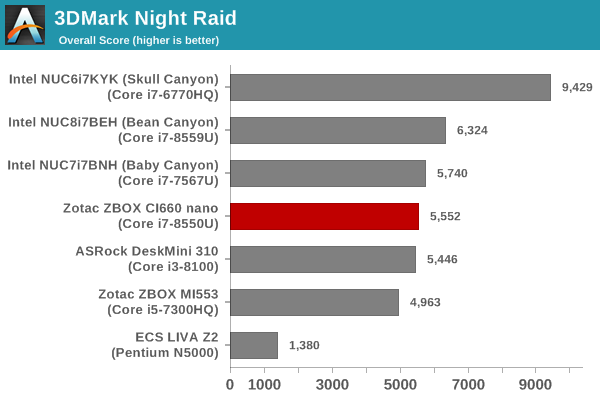
The 3DMark numbers show the CI660 nano coming consistently in the middle of the pack. The Iris Plus Graphics-enabled systems are obviously geared to show better numbers. Despite that, the CI660 nano manages to outperform other actively cooled PCs with similar or better GPU configurations (such as the Core i3-8100 / Intel UHD Graphics 630-based DeskMini 310).


23 Comments
View All Comments
jgraham11 - Tuesday, April 16, 2019 - link
BAPCo's SYSmark 2018 is an application-based benchmark that has been developed by Intel engineers for Intel CPUs and does not truly reflect performance of any real world application by any other chip vendor. The fact that every other chip maker have all abandoned Bapco's boards tell you something. This is a known conflict of interest that degrades Anandtech's credibility by highlighting it. At least in the past the articles, these conflicts were pointed out regarding Bapco's shaky past.Daeros - Tuesday, April 16, 2019 - link
Anandtech's quality has been on a continuous downward slide, including increasing Intel/Nvidia bias, ever since Anand left. The site looks and sounds like it's written by children now - especially including comments the editorial staff post in comments sections and on twitter.Eris_Floralia - Tuesday, April 16, 2019 - link
Hey what about my AndreiDigitalFreak - Tuesday, April 16, 2019 - link
While I would agree that the quality is not near as good as it was when Anand was around, I don't see any bias.PeachNCream - Thursday, April 18, 2019 - link
Read literally anything written about a Killer NIC.rrinker - Tuesday, April 16, 2019 - link
Seems like this article only compares Intel systems to other Intel systems - so what's the problem? Other than, of course, this article does not agree with some personal bias of yours, therefore all of Anandtech is now not credible, etc. A little extreme reaction don't you think? But such is the way witht he extremism in EVERYTHING these days. Social media has destroyed any chance for critical thinking. Anandtech does an article that's positive towards Intel, OMG BIASED, They hate AMD. They write a different article that's positive towards an AMD product - OMG BIASED! Why the hate on Intel?Irata - Tuesday, April 16, 2019 - link
Yup, using a benchmark by Bapco in which no chip company besides Intel seems to have confidence does leave a rather bad taste.nVidia, AMD and VIA all left the consortium back in 2011 and prior to that Bapco was found to have modified their benchmarks in a way that favored Intel CPU
Ryan Smith - Wednesday, April 17, 2019 - link
SYSmark 2018 is one of several tools we use in this article. It is certainly not the only tool we use, and it's not a tool we use in all situations (e.g. architecture deep dives). Meanwhile for SFF PCs in particular, its power measurement capabilities are pretty handy to have. Plus the only other systems we're comparing it to are all Intel-based anyhow.MDD1963 - Thursday, April 18, 2019 - link
If BAPCO SYSMark was developed by Intel engineers, this would seem more an issue if/when comparing Intel systems to AMD, and not really an issue when comparing all Intel systems...mammothboy - Tuesday, April 16, 2019 - link
The Realtec NICs may be a blessing for use with Windows Server (Intel has a nasty habit of not providing drivers for many of their NICs). Having two will let you set up a team there (perhaps to use as a AD/DNS server) or use as a firewall/router (not that I'd use Windows Server for either).I've generally had good luck with Realtec with Windows Server and PFSense.