The Inland Performance Plus 2TB SSD Review: Phison's E18 NVMe Controller Tested
by Billy Tallis on May 13, 2021 8:00 AM ESTAnandTech Storage Bench - The Destroyer
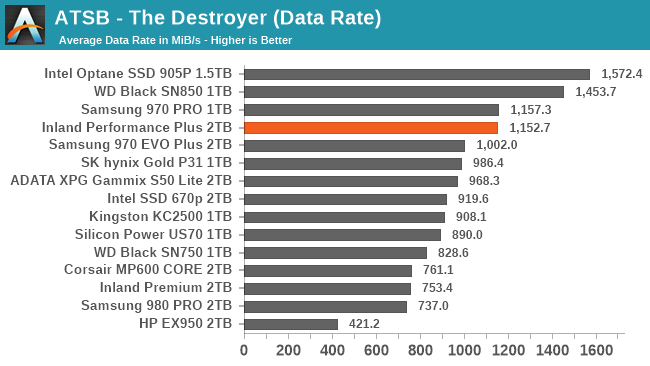
Our AnandTech Storage Bench tests are traces (recordings) of real-world IO patterns that are replayed onto the drives under test. The Destroyer is the longest and most difficult phase of our consumer SSD test suite. For more details, please see the overview of our 2021 Consumer SSD Benchmark Suite.
 |
|||||||||
| Average Data Rate | |||||||||
| Average Latency | Average Read Latency | Average Write Latency | |||||||
| 99th Percentile Latency | 99th Percentile Read Latency | 99th Percentile Write Latency | |||||||
| Energy Usage | |||||||||
The Inland Performance Plus delivers excellent overall performance on The Destroyer, but the WD Black SN850 beats it on almost every subscore. The best result from the E18 drive is with write latency, where it is the clear leader in average latency and a close second in 99th percentile latency. The energy efficiency of the Inland Performance Plus is poor—common for high-end drives, but Samsung and especially WD are better here.
AnandTech Storage Bench - Heavy
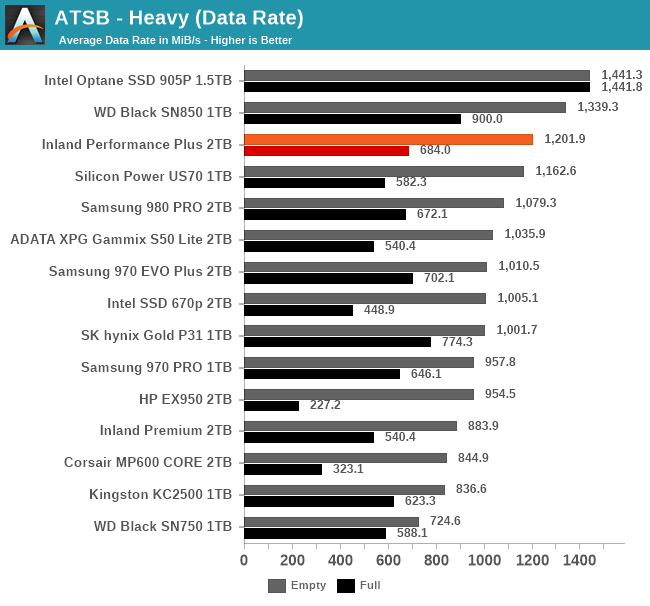
The ATSB Heavy test is much shorter overall than The Destroyer, but is still fairly write-intensive. We run this test twice: first on a mostly-empty drive, and again on a completely full drive to show the worst-case performance.
 |
|||||||||
| Average Data Rate | |||||||||
| Average Latency | Average Read Latency | Average Write Latency | |||||||
| 99th Percentile Latency | 99th Percentile Read Latency | 99th Percentile Write Latency | |||||||
| Energy Usage | |||||||||
On the Heavy test, the Inland Performance Plus delivers great performance, though again it falls short of the WD Black SN850. It's also only a small improvement over the Phison E16-based Silicon Power US70, and several of the best Gen3 drives end up with better performance when testing against a full drive. The Performance Plus is also one of the most power-hungry drives on this test, again requiring almost 50% more energy to finish the tests than the WD Black SN850.
AnandTech Storage Bench - Light
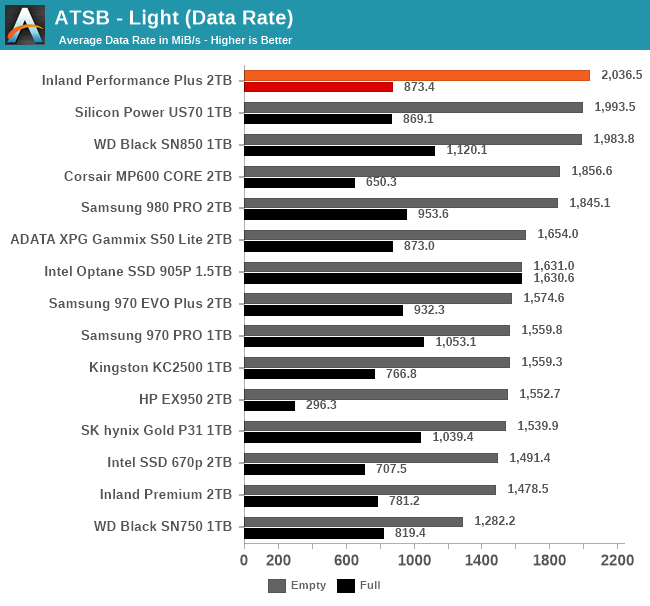
The ATSB Light test represents ordinary everyday usage that doesn't put much strain on a SSD. Low queue depths, short bursts of IO and a short overall test duration mean this should be easy for any SSD. But running it a second time on a full drive shows how even storage-light workloads can be affected by SSD performance degradation.
 |
|||||||||
| Average Data Rate | |||||||||
| Average Latency | Average Read Latency | Average Write Latency | |||||||
| 99th Percentile Latency | 99th Percentile Read Latency | 99th Percentile Write Latency | |||||||
| Energy Usage | |||||||||
The Inland Performance Plus manages a first-place finish for overall performance on the Light test, but it's only a hair faster than the Phison E16 drive or the WD Black SN850—and the WD Black has significantly better performance on the full-drive test run. The Performance Plus also doesn't quite manage first place on most of the latency subscores, and it shows a larger full-drive penalty to the write latency scores than most other high-end drives. The Inland Performance Plus is also in last place for energy usage.
PCMark 10 Storage Benchmarks
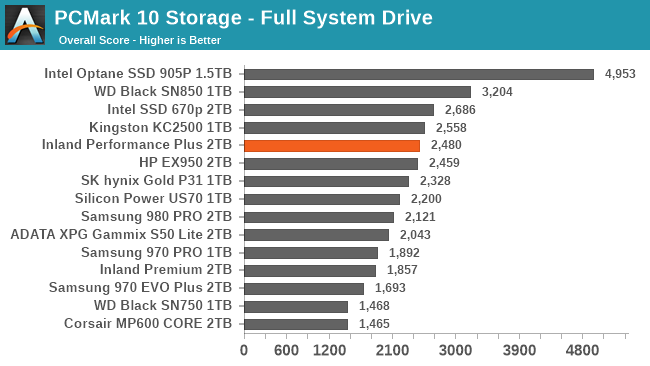
The PCMark 10 Storage benchmarks are IO trace based tests similar to our own ATSB tests. For more details, please see the overview of our 2021 Consumer SSD Benchmark Suite.
 |
|||||||||
| Full System Drive | Overall Score | Average Bandwidth | Average Latency | ||||||
| Quick System Drive | Overall Score | Average Bandwidth | Average Latency | ||||||
| Data Drive | Overall Score | Average Bandwidth | Average Latency | ||||||
The Inland Performance Plus provides decent but not chart-topping performance on the PCMark 10 Storage tests. For the Full System Drive and Quick System Drive tests it is not able to outperform some of the faster Silicon Motion-based NVMe drives that usually provide lower random read latency than Phison drives. On the Data Drive test that is more focused on sequential IO, several older Phison drives provide better performance, suggesting that the firmware for the E18 is tuned more for general real-world performance rather than exclusively trying to maximize simple benchmark scores—but we'd still like to see a controller this powerful consistently beating its predecessors on all kinds of workloads.


118 Comments
View All Comments
FatFlatulentGit - Thursday, May 13, 2021 - link
Is there a reason the Sabrent Rocket 4 Plus never shows up in the benches? I'm baffled that AT didn't review that one as it uses the Phison E18 and came out about six months ago. You don't even include it in your bench results and it's a flagship PCIe4 M.2 drive. What gives?Linustechtips12#6900xt - Thursday, May 13, 2021 - link
could just be they didn't think of it,Death666Angel - Thursday, May 13, 2021 - link
They probably didn't get sampled one. Sabrent seems more like a non-brand type option and thus likely does not have much of a PR presence.Billy Tallis - Thursday, May 13, 2021 - link
The timing of the first round of review samples of the Rocket 4 Plus didn't work out for us, because I was still putting the finishing touches on the new test suite and had a bit of a backlog of other Gen4 drives to review first. By the time I was ready to start testing an E18 drive, Inland was offering to sample several of their drives, and they're also a frequently requested brand. It wouldn't make sense to review the Rocket 4 Plus now because it's the same underlying hardware as the Inland Performance Plus. We'll wait for the 176L NAND before doing another E18 review.Chaser - Thursday, May 13, 2021 - link
Until Microsoft unshackles Windows from the magnetic Hard disk era, the perceptible difference between most SSDs in Windows desktop is miniscule. But I suppose these reviews and their hairsplitting synthetic benchmarks get clicks.Marlin1975 - Thursday, May 13, 2021 - link
What are you talking about? Performance between platter disk and SSD/M.2 is day and night.evilpaul666 - Thursday, May 13, 2021 - link
There is a huge difference between rust and flash, but we could use some major software improvements and architectural improvements to PCs to move them forward. Maybe persistent memory? A better file system that uses something like compression and checksums on everything similar to ZFS?GeoffreyA - Thursday, May 13, 2021 - link
NTFS has had compression since NT 3.51 or 4, and ReFS, checksums.DougMcC - Sunday, May 16, 2021 - link
It's great and all but linux/mac do most disk intensive activities close to twice as fast. Mac and Linux have completely taken over at my company because of this.GeoffreyA - Sunday, May 16, 2021 - link
Haven't got much experience with Linux but yes, I believe its performance beats Windows on a lot of points.