Samsung Portable SSD T7 Shield 4TB Review: IP65 PSSD Gets a Capacity Upgrade
by Ganesh T S on January 31, 2023 10:00 AM ESTPerformance Benchmarks
Benchmarks such as ATTO and CrystalDiskMark help provide a quick look at the performance of the direct-attached storage device. The results translate to the instantaneous performance numbers that consumers can expect for specific workloads, but do not account for changes in behavior when the unit is subject to long-term conditioning and/or thermal throttling. Yet another use of these synthetic benchmarks is the ability to gather information regarding support for specific storage device features that affect performance.
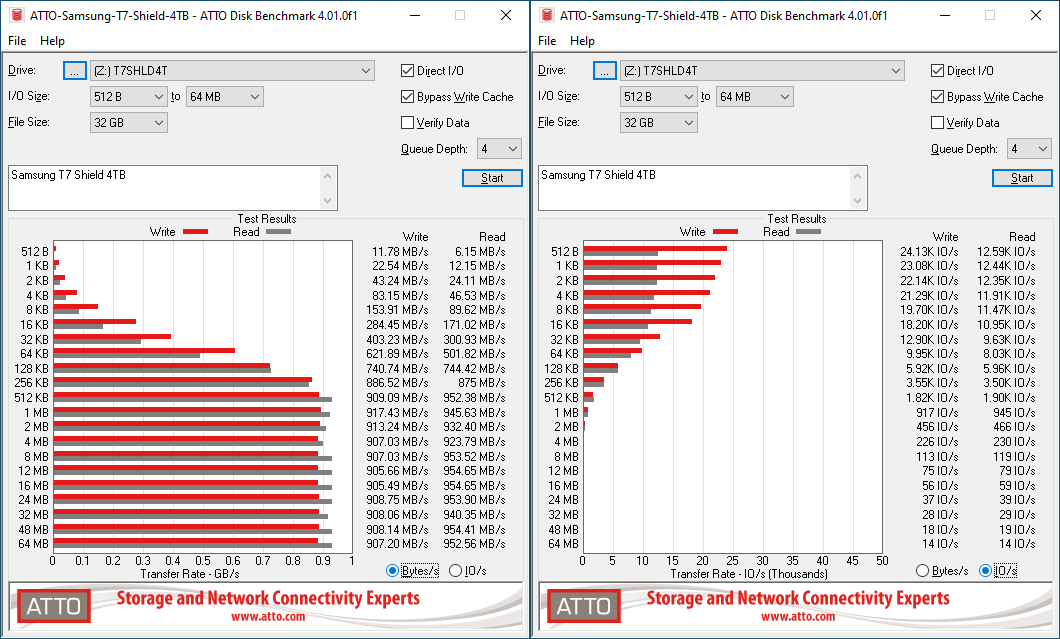
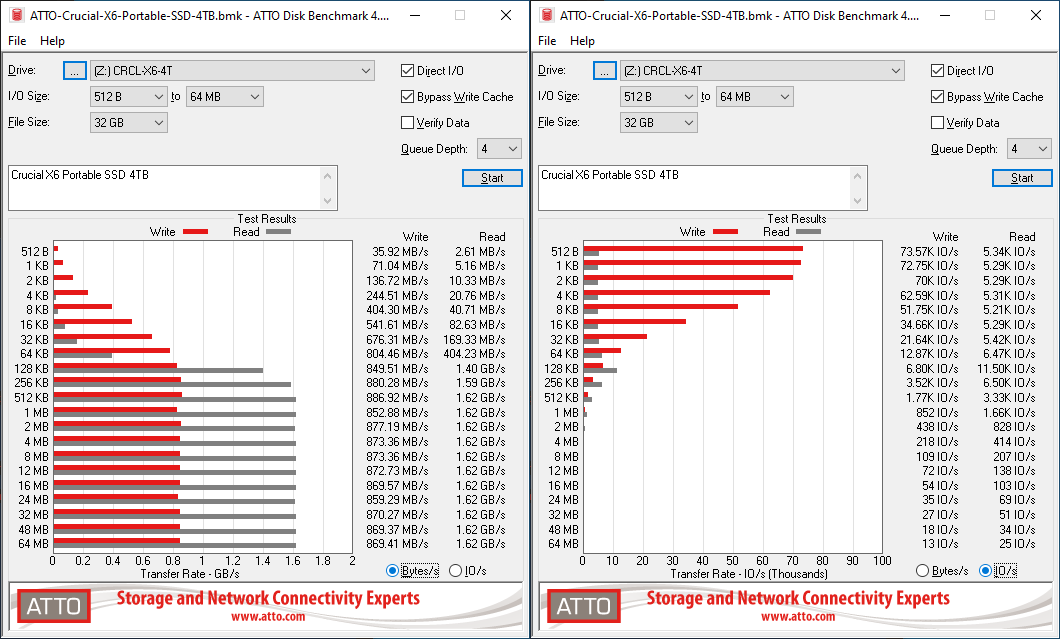
Samsung claims speeds of up to 1050 MBps for the T7 Shield 4TB version. Our ATTO testing configuration manages to reach numbers quite close to the advertised one. However, we only use a single queue depth of 4 - so, it is only representative of a small subset of real-world workloads. It does allow the visualization of change in transfer rates as the I/O size changes, with optimal performance being reached around 512 KB for a queue depth of 4. The most interesting comparison in the set below is actually against the 2TB version of the T7 Shield. We find that for the same access trace, there is a slight drop in performance.
| ATTO Benchmarks | |
| TOP: | BOTTOM: |
 |
|
 |
|
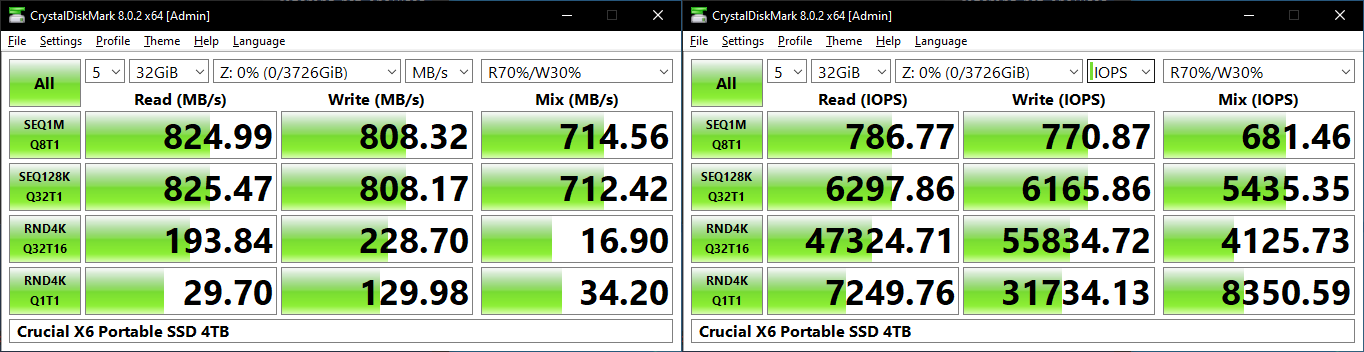
CrystalDiskMark. for example, uses four different access traces for reads and writes over a configurable region size. Two of the traces are sequential accesses, while two are 4K random accesses. Internally, CrystalDiskMark uses the Microsoft DiskSpd storage testing tool. The 'Seq128K Q32T1' sequential traces use 128K block size with a queue depth of 32 from a single thread, while the '4K Q32T16' one does random 4K accesses with the same queue configuration, but from multiple threads. The 'Seq1M' traces use a 1MiB block size. The plain 'Rnd4K' one uses only a single queue and single thread . Comparing the '4K Q32T16' and '4K Q1T1' numbers can quickly tell us whether the storage device supports NCQ (native command queuing) / UASP (USB-attached SCSI protocol). If the numbers for the two access traces are in the same ballpark, NCQ / UASP is not supported. This assumes that the host port / drivers on the PC support UASP.
| CrystalDiskMark Benchmarks | |
| TOP: | BOTTOM: |
 |
|
 |
|
The numbers in the above benchmark fall slightly short of Samsung's claims, unlike what was seen for the 2TB version. However, it is still in the same ballpark. Both NCQ and UASP are supported. However, the 4K random access numbers seem abysmally low, which might affect performance in real-world workloads that are not large file transfers.
AnandTech DAS Suite - Benchmarking for Performance Consistency
Our testing methodology for storage bridges / direct-attached storage units takes into consideration the usual use-case for such devices. The most common usage scenario is transfer of large amounts of photos and videos to and from the unit. Other usage scenarios include the use of the unit as a download or install location for games and importing files directly from it into a multimedia editing program such as Adobe Photoshop. Some users may even opt to boot an OS off an external storage device.
The AnandTech DAS Suite tackles the first use-case. The evaluation involves processing five different workloads:
- AV: Multimedia content with audio and video files totalling 24.03 GB over 1263 files in 109 sub-folders
- Home: Photos and document files totalling 18.86 GB over 7627 files in 382 sub-folders
- BR: Blu-ray folder structure totalling 23.09 GB over 111 files in 10 sub-folders
- ISOs: OS installation files (ISOs) totalling 28.61 GB over 4 files in one folder
- Disk-to-Disk: Addition of 223.32 GB spread over 171 files in 29 sub-folders to the above four workloads (total of 317.91 GB over 9176 files in 535 sub-folders)
Except for the 'Disk-to-Disk' workload, each data set is first placed in a 29GB RAM drive, and a robocopy command is issue to transfer it to the external storage unit (formatted in exFAT for flash-based units, and NTFS for HDD-based units).
robocopy /NP /MIR /NFL /J /NDL /MT:32 $SRC_PATH $DEST_PATH
Upon completion of the transfer (write test), the contents from the unit are read back into the RAM drive (read test) after a 10 second idling interval. This process is repeated three times for each workload. Read and write speeds, as well as the time taken to complete each pass are recorded. Whenever possible, the temperature of the external storage device is recorded during the idling intervals. Bandwidth for each data set is computed as the average of all three passes.
The 'Disk-to-Disk' workload involves a similar process, but with one iteration only. The data is copied to the external unit from the CPU-attached NVMe drive, and then copied back to the internal drive. It does include more amount of continuous data transfer in a single direction, as data that doesn't fit in the RAM drive is also part of the workload set.
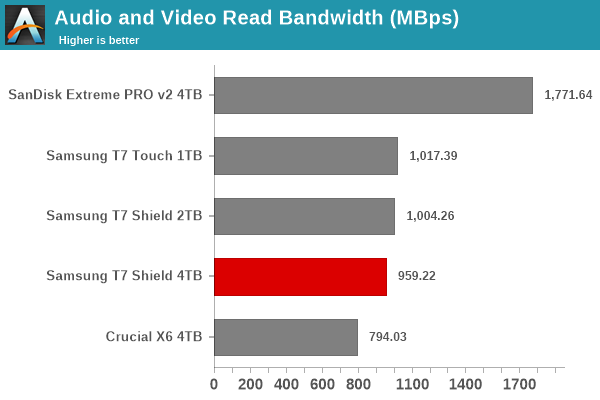
It can be seen that there is no significant gulf in the numbers between the different units of the same performance class. The 4TB T7 Shield is consistently above the Crucial X6, but comes a little behind in the numbers when compared against its 2TB cousin. That said, for all practical purposes, the casual user will notice no difference between the 2TB and 4TB versions in the course of normal usage. However, power users may want to dig deeper to understand the limits of each device. To address this concern, we also instrumented our evaluation scheme for determining performance consistency.
Performance Consistency
Aspects influencing the performance consistency include SLC caching and thermal throttling / firmware caps on access rates to avoid overheating. This is important for power users, as the last thing that they want to see when copying over 100s of GB of data is the transfer rate going down to USB 2.0 speeds.
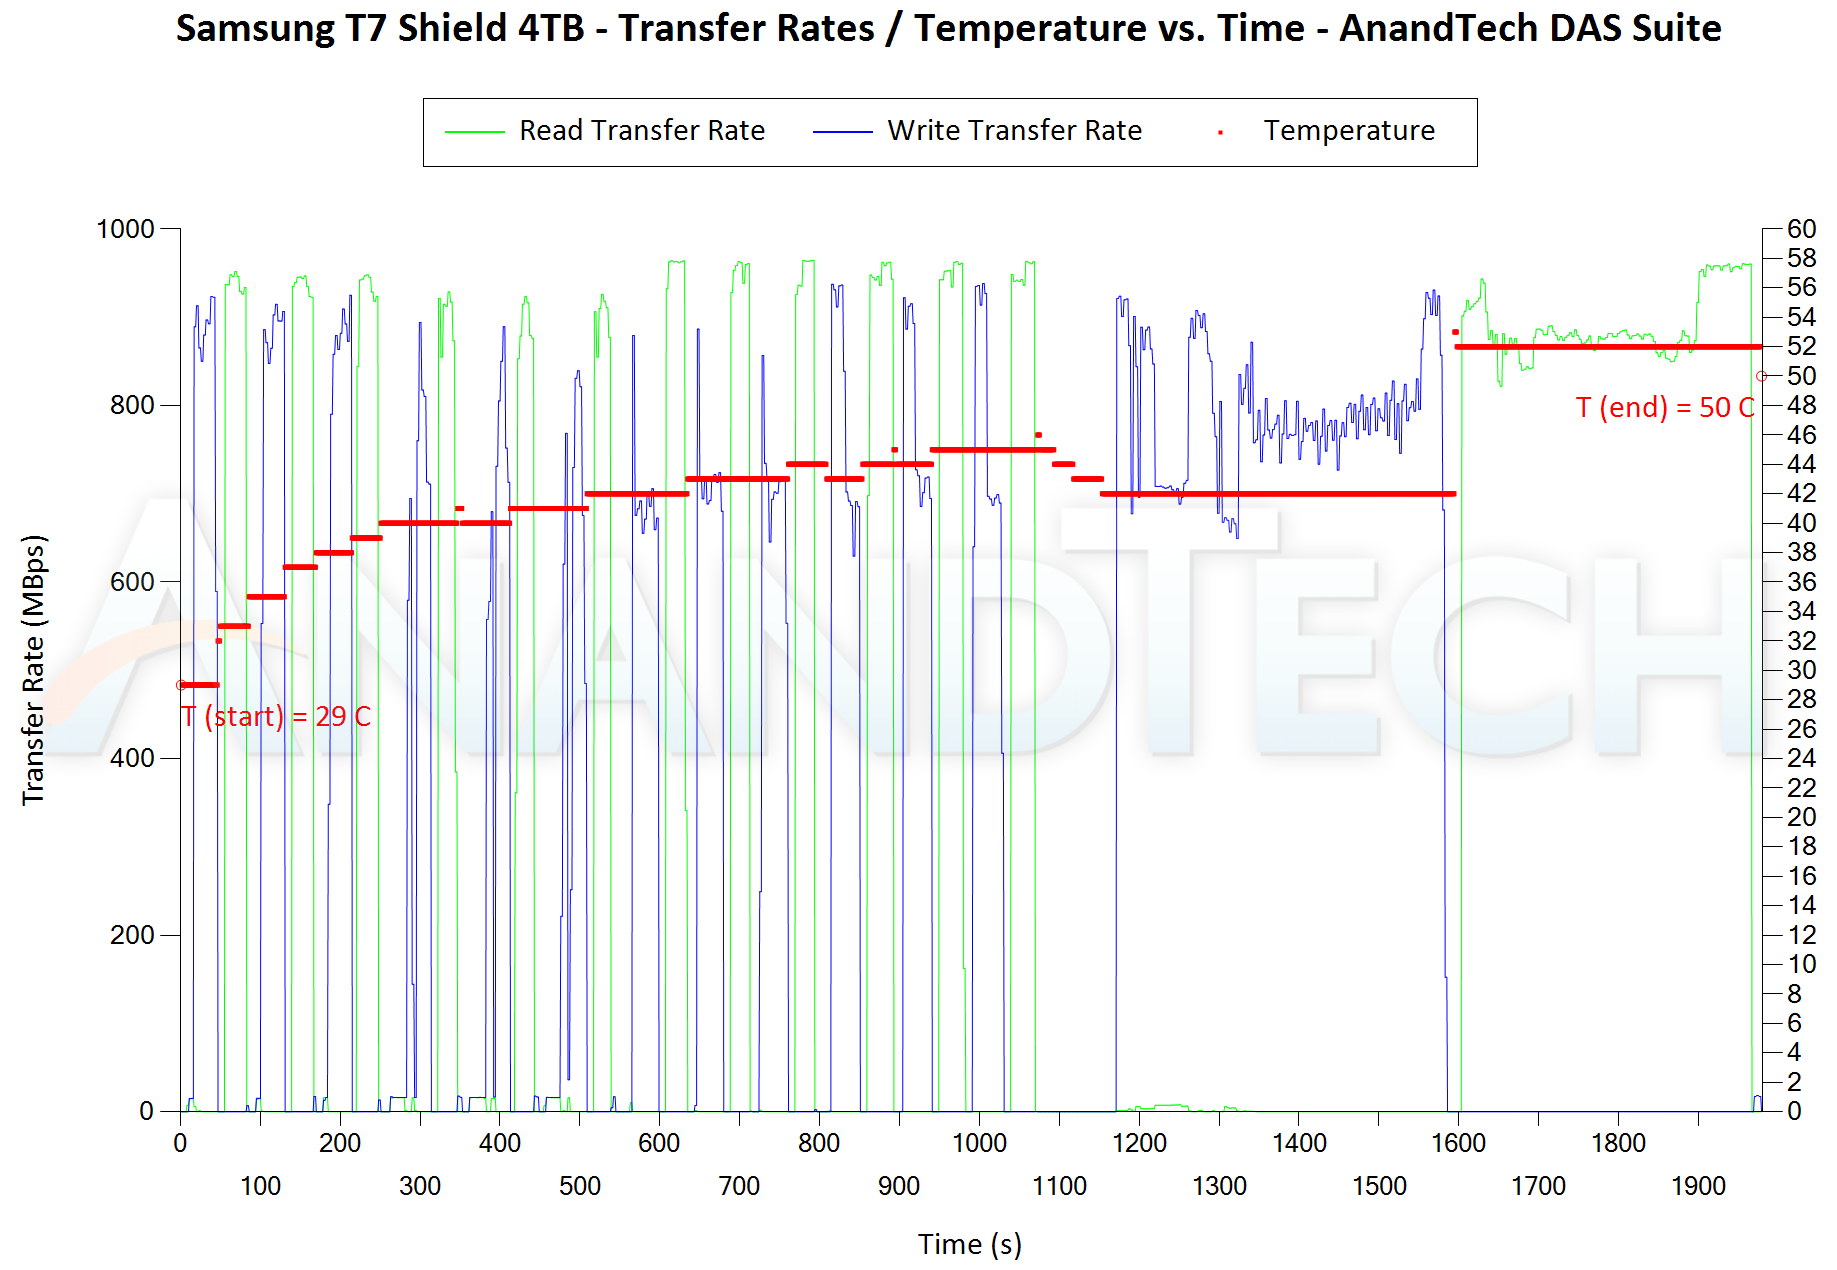
In addition to tracking the instantaneous read and write speeds of the DAS when processing the AnandTech DAS Suite, the temperature of the drive was also recorded. In earlier reviews, we used to track the temperature all through. However, we have observed that SMART read-outs for the temperature in NVMe SSDs using USB 3.2 Gen 2 bridge chips end up negatively affecting the actual transfer rates. To avoid this problem, we have restricted ourselves to recording the temperature only during the idling intervals. The graphs below present the recorded data.
| AnandTech DAS Suite - Performance Consistency | |
| TOP: | BOTTOM: |
 |
|
 |
|
The first three sets of writes and reads correspond to the AV suite. A small gap (for the transfer of the video suite from the internal SSD to the RAM drive) is followed by three sets for the Home suite. Another small RAM-drive transfer gap is followed by three sets for the Blu-ray folder. This is followed up with the large-sized ISO files set. Finally, we have the single disk-to-disk transfer set.
The T7 Shield 2TB version has very good performance consistency, with the SLC cliff barely seen in the transfer sets. However, with the 4TB version, the third iteration of the home suite sees a slight drop in the write transfer rate. The blip is more noticeable in the disk-to-disk transfer set.
PCMark 10 Storage Bench - Real-World Access Traces
There are a number of storage benchmarks that can subject a device to artificial access traces by varying the mix of reads and writes, the access block sizes, and the queue depth / number of outstanding data requests. We saw results from two popular ones - ATTO, and CrystalDiskMark - in a previous section. More serious benchmarks, however, actually replicate access traces from real-world workloads to determine the suitability of a particular device for a particular workload. Real-world access traces may be used for simulating the behavior of computing activities that are limited by storage performance. Examples include booting an operating system or loading a particular game from the disk.
PCMark 10's storage bench (introduced in v2.1.2153) includes four storage benchmarks that use relevant real-world traces from popular applications and common tasks to fully test the performance of the latest modern drives:
- The Full System Drive Benchmark uses a wide-ranging set of real-world traces from popular applications and common tasks to fully test the performance of the fastest modern drives. It involves a total of 204 GB of write traffic.
- The Quick System Drive Benchmark is a shorter test with a smaller set of less demanding real-world traces. It subjects the device to 23 GB of writes.
- The Data Drive Benchmark is designed to test drives that are used for storing files rather than applications. These typically include NAS drives, USB sticks, memory cards, and other external storage devices. The device is subjected to 15 GB of writes.
- The Drive Performance Consistency Test is a long-running and extremely demanding test with a heavy, continuous load for expert users. In-depth reporting shows how the performance of the drive varies under different conditions. This writes more than 23 TB of data to the drive.
Despite the data drive benchmark appearing most suitable for testing direct-attached storage, we opt to run the full system drive benchmark as part of our evaluation flow. Many of us use portable flash drives as boot drives and storage for Steam games. These types of use-cases are addressed only in the full system drive benchmark.
The Full System Drive Benchmark comprises of 23 different traces. For the purpose of presenting results, we classify them under five different categories:
- Boot: Replay of storage access trace recorded while booting Windows 10
- Creative: Replay of storage access traces recorded during the start up and usage of Adobe applications such as Acrobat, After Effects, Illustrator, Premiere Pro, Lightroom, and Photoshop.
- Office: Replay of storage access traces recorded during the usage of Microsoft Office applications such as Excel and Powerpoint.
- Gaming: Replay of storage access traces recorded during the start up of games such as Battlefield V, Call of Duty Black Ops 4, and Overwatch.
- File Transfers: Replay of storage access traces (Write-Only, Read-Write, and Read-Only) recorded during the transfer of data such as ISOs and photographs.
PCMark 10 also generates an overall score, bandwidth, and average latency number for quick comparison of different drives. The sub-sections in the rest of the page reference the access traces specified in the PCMark 10 Technical Guide.
Booting Windows 10
The read-write bandwidth recorded for each drive in the boo access trace is presented below.
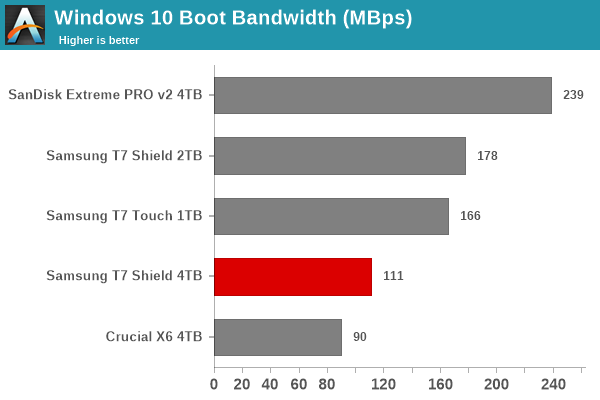
The presence of additional flash packages seems to negatively affect the performance. While being better than the Crucial X6, the other PSSDs are ahead by a significant margin.
Creative Workloads
The read-write bandwidth recorded for each drive in the sacr, saft, sill, spre, slig, sps, aft, exc, ill, ind, psh, and psl access traces are presented below.
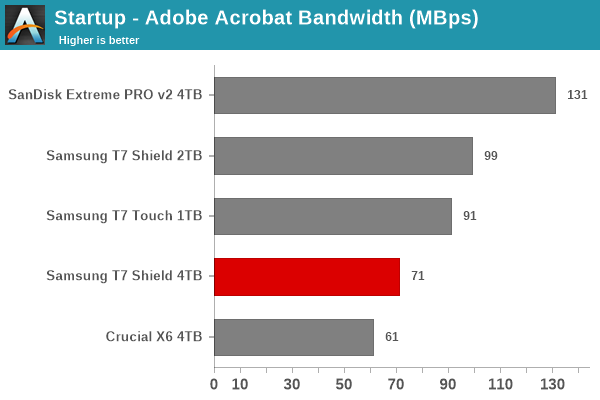
In most of the workloads, the relative ordering seen in the boot workload is repeated. However, in a few cases, we see the 4TB T7 Shield move to the middle of the pack.
Office Workloads
The read-write bandwidth recorded for each drive in the exc and pow access traces are presented below.
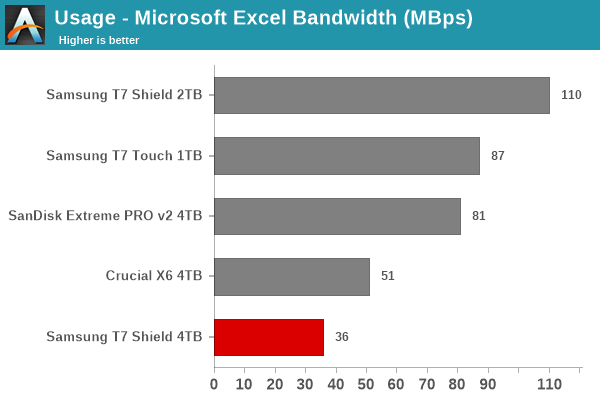
Both MS Office workload components see the 4TB Shield fare quite badly, ending up even worse than the Crucial X6 4TB.
Gaming Workloads
The read-write bandwidth recorded for each drive in the bf, cod, and ow access traces are presented below.
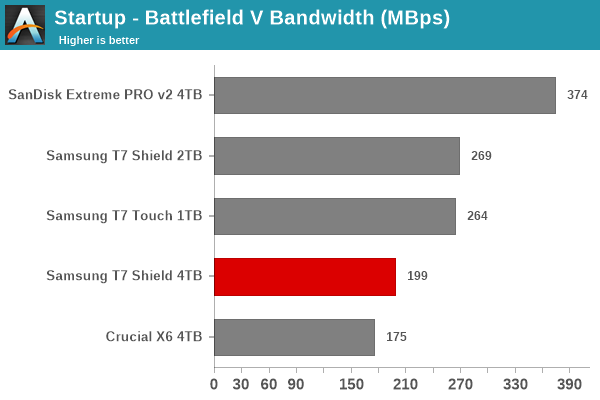
The relative ordering seen in the boot workload is repeated here.
Files Transfer Workloads
The read-write bandwidth recorded for each drive in the cp1, cp2, cp3, cps1, cps2, and cps3 access traces are presented below.
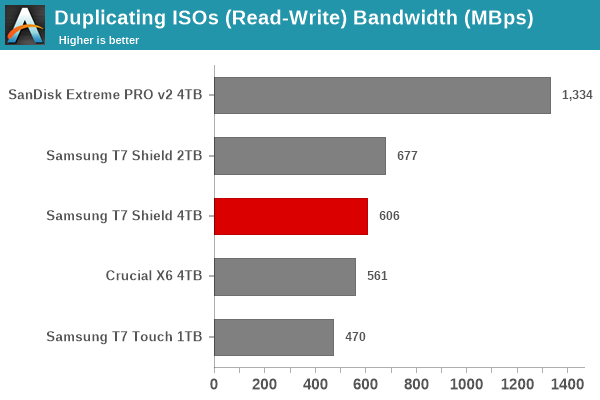
For file transfers, the 4TB T7 Shield fares a bit better, managing to slot in the middle of the pack.
Overall Scores
PCMark 10 reports an overall score based on the observed bandwidth and access times for the full workload set. The score, bandwidth, and average access latency for each of the drives are presented below.
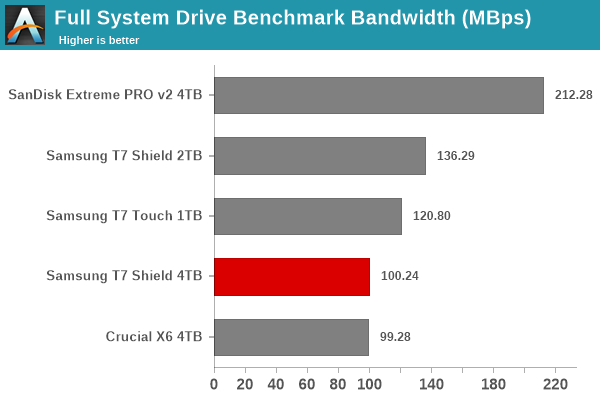
Overall, the 4TB T7 Shield surprisingly slots in closer to the Crucial X6 rather than the other PSSDs - a result of the drive's abysmal random access numbers.


12 Comments
View All Comments
ballsystemlord - Tuesday, January 31, 2023 - link
This drive loses to it's own other SKUs. I'm laughing at it. This is ridiculous, especially at this price point.ganeshts - Tuesday, January 31, 2023 - link
It is not surprising to see high-capacity SKUs fare a bit worse than the lower capacity ones, but, yes, the gulf in random performance is quite bad.It appears Samsung has optimized completely for sequential DAS workloads (we can see improvement in the 'SLC cliff' scenario), but at the cost of random access performance.
kkromm - Tuesday, January 31, 2023 - link
You can buy any number of NVME thunderbolt enclosures add your own SSD and far exceed these numbers for the same price. The fastest speed I have gotten so far is the new Samsung 990 Pro which was close to 2700mps read and write, but that is only available in 2TB.ganeshts - Tuesday, January 31, 2023 - link
IP65-rated enclosures for NVMe SSDs are not very common. Also, 4TB internal SSDs are way overpriced compared to their external counterparts.There is a value proposition possible with these high-capacity PSSDs (very evident in the Crucial X6 and SanDisk Extreme Pro v2) - just that the current pricing makes it a bad one for the T7 Shield.
Chaitanya - Tuesday, January 31, 2023 - link
4TB version of that drive is supposed to be released in March or April. Its a real shame Samsung has been sticking 2TB as upper celing on their M.2 drives for for so long while there are higher capacity M.2 drives on market for quite sometime now and seem to be selling well.Shame that Samsung has started to fully solder components on their external SSDs while in past there was an option to remove SSD in case of failure.
Alistair - Friday, February 3, 2023 - link
I bought the Asus external nvme SSD enclosure, the most expensive one. Nothing but problems, random disconnects. Meanwhile my Samsung external is reliable. So yeah.Samus - Wednesday, February 1, 2023 - link
It's shit products like this that are still having enthusiasts building their own portable SSD's out of an NVMe USB adapter, which cost less, cool better and achieve 20Gbps.meacupla - Wednesday, February 1, 2023 - link
I'm genuinely curious to know if IP65 is even necessary.Do people spill liquids onto their external drives?
I know that people spill liquids onto their laptops and keyboards all the time, because those are in the primary work space, and people tend to put their drinks in that space.
However, I have yet to encounter anyone who got liquid onto their external drive, because those tend to sit off to the side, or behind the primary work space.
CalifLove00 - Monday, February 13, 2023 - link
I wonder this very thing. Maybe for the crowd that treats these things like USB thumb sticks.. I have washed a few of those by mistake in laundry...I suppose it's possible? I'd like to think people are a little more careful with $100+ devices than free ones but you never know? Beyond that - the water/dust resistance of this drive isn't a needle mover for me.Maldon - Friday, February 17, 2023 - link
Some people use their portable drives outdoors, away from the protection of a building. That's one of the advantages of portable storage. When I'm trekking in the Himalaya or Andes, it's reassuring to know my portable SSDs are IP65 rated. You never know when your bag is going to fall into a mountain stream or get drenched in a rain storm. Of course you can wrap everything in plastic bags or use a waterproof PeliCase, but extra protection for irreplaceable photos and video files is important.