SanDisk Professional PRO-BLADE Portable SSD Ecosystem Review
by Ganesh T S on March 7, 2024 8:00 AM ESTBenchmarks such as ATTO and CrystalDiskMark help provide a quick look at the performance of the direct-attached storage device. The results translate to the instantaneous performance numbers that consumers can expect for specific workloads, but do not account for changes in behavior when the unit is subject to long-term conditioning and/or thermal throttling. Yet another use of these synthetic benchmarks is the ability to gather information regarding support for specific storage device features that affect performance.
Synthetic Benchmarks - ATTO and CrystalDiskMark
Benchmarks such as ATTO and CrystalDiskMark help provide a quick look at the performance of the direct-attached storage device. The results translate to the instantaneous performance numbers that consumers can expect for specific workloads, but do not account for changes in behavior when the unit is subject to long-term conditioning and/or thermal throttling. Yet another use of these synthetic benchmarks is the ability to gather information regarding support for specific storage device features that affect performance.
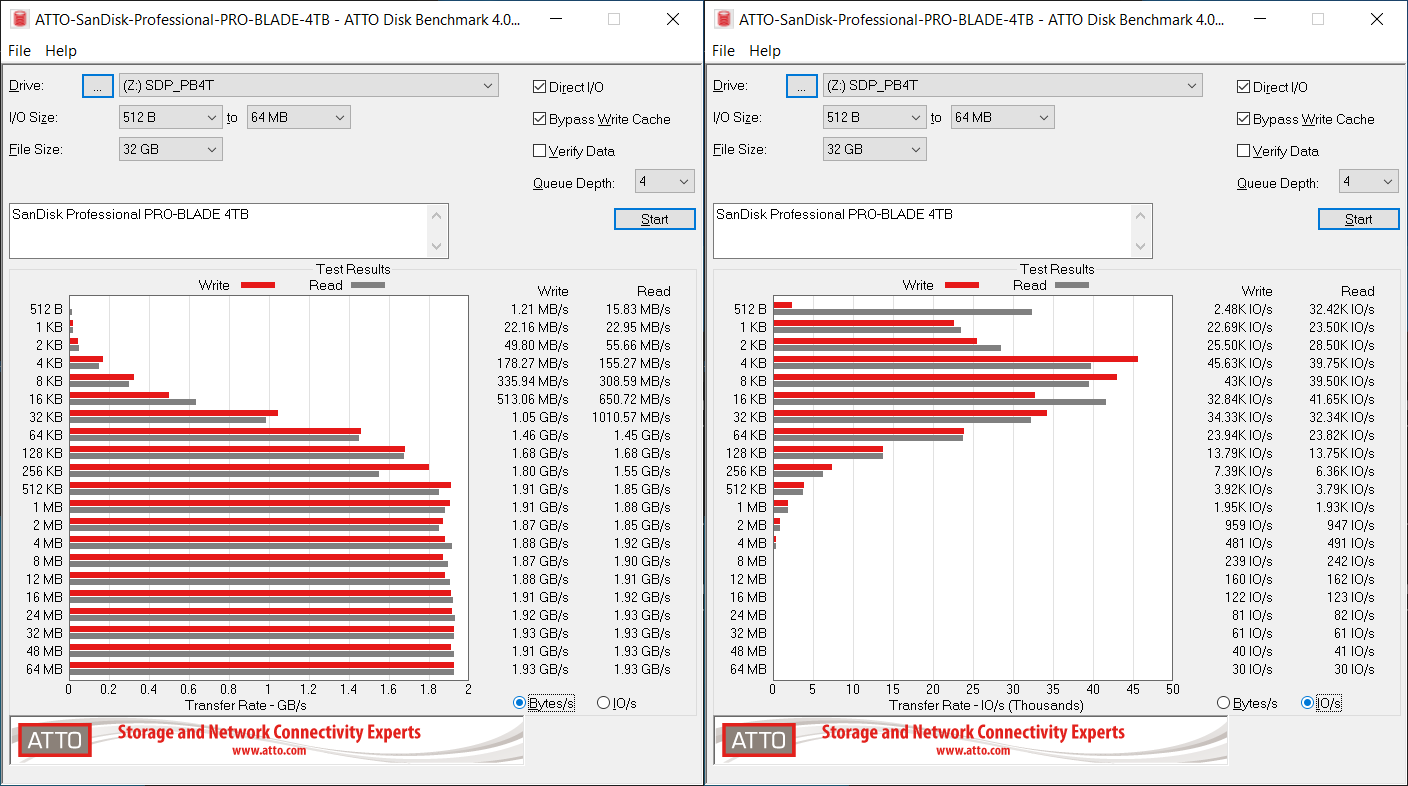
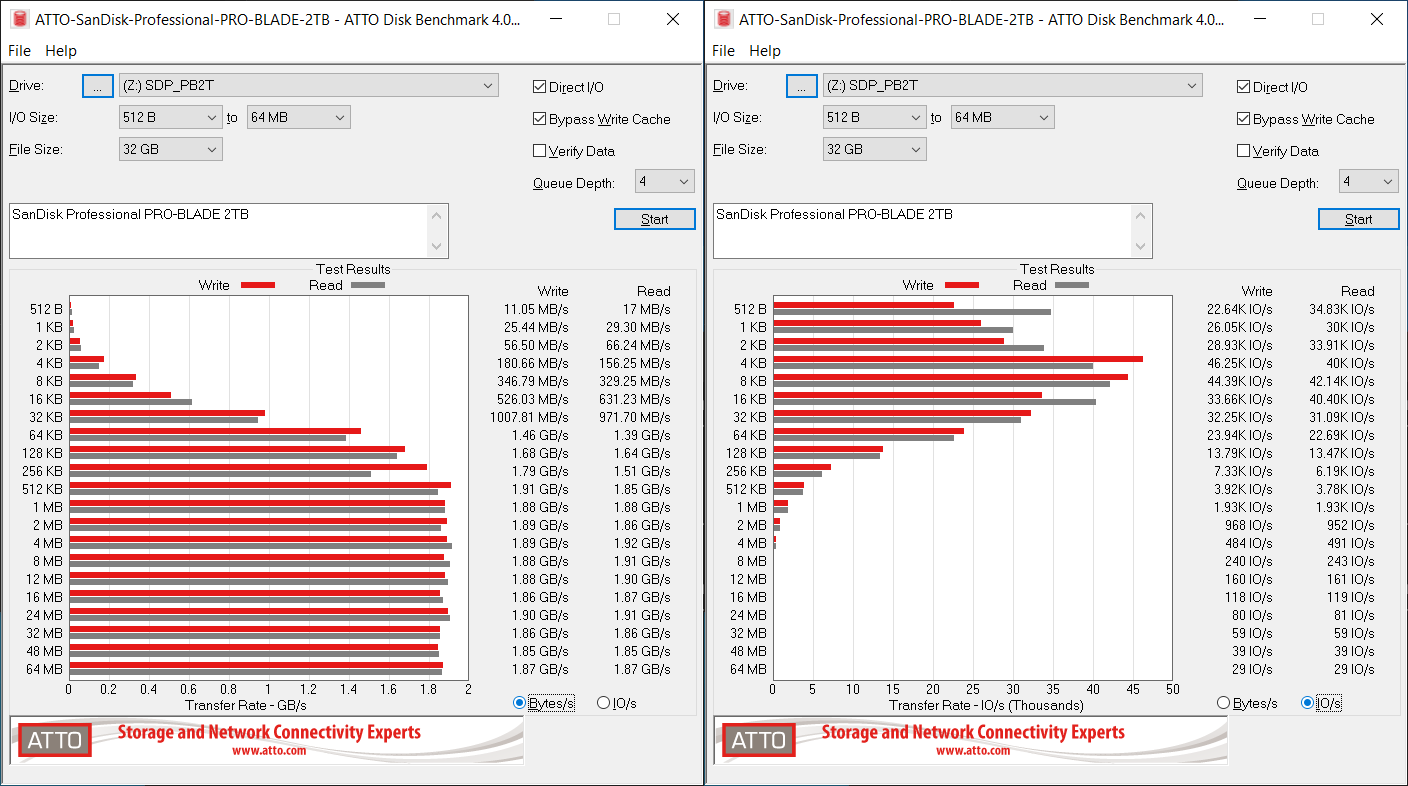
Western Digital claims offloading speeds of up to 3000 MBps for the PRO-BLADE SSD Mag, but that is possible only with the PRO-BLADE STATION desktop Thunderbolt enclosure. Given that claim, we expect the TRANSPORT configurations to be able to saturate the 20 Gbps bandwidth of the USB 3.2 Gen 2x2 connection. That is backed up by the ATTO benchmarks provided below. ATTO benchmarking is restricted to a single configuration in terms of queue depth, and is only representative of a small sub-set of real-world workloads. It does allow the visualization of change in transfer rates as the I/O size changes, with optimal performance being reached around 512 KB for a queue depth of 4.
| ATTO Benchmarks | |
| TOP: | BOTTOM: |
 |
|
 |
|
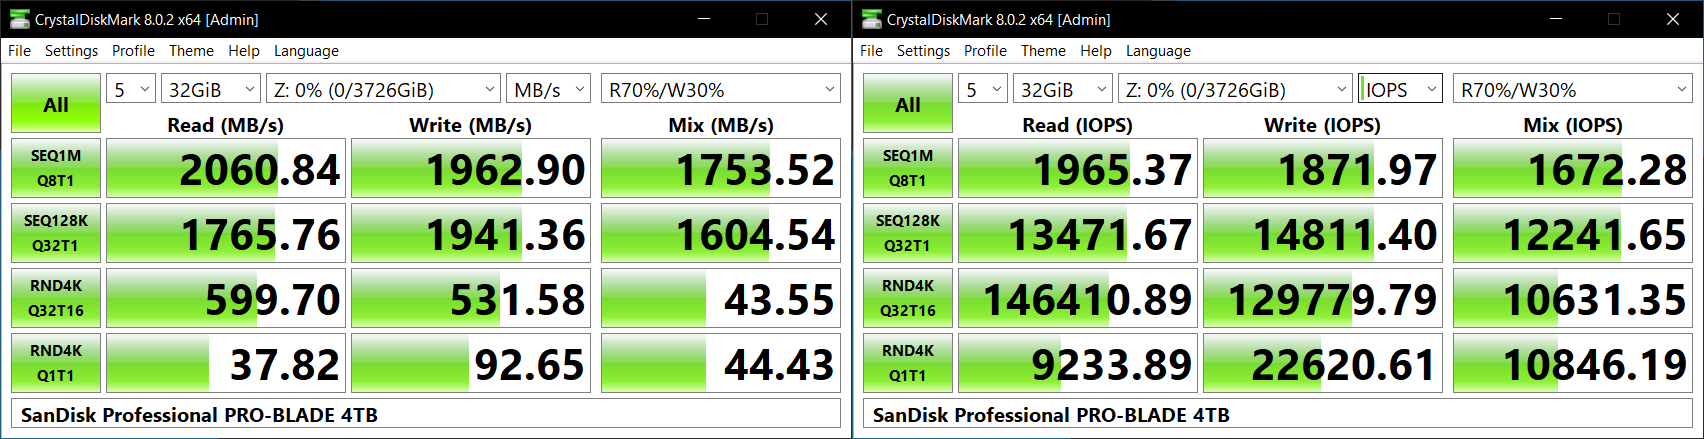
CrystalDiskMark, for example, uses four different access traces for reads and writes over a configurable region size. Two of the traces are sequential accesses, while two are 4K random accesses. Internally, CrystalDiskMark uses the Microsoft DiskSpd storage testing tool. The 'Seq128K Q32T1' sequential traces use 128K block size with a queue depth of 32 from a single thread, while the '4K Q32T16' one does random 4K accesses with the same queue configuration, but from multiple threads. The 'Seq1M' traces use a 1MiB block size. The plain 'Rnd4K' one uses only a single queue and single thread . Comparing the '4K Q32T16' and '4K Q1T1' numbers can quickly tell us whether the storage device supports NCQ (native command queuing) / UASP (USB-attached SCSI protocol). If the numbers for the two access traces are in the same ballpark, NCQ / UASP is not supported. This assumes that the host port / drivers on the PC support UASP.
| CrystalDiskMark Benchmarks | |
| TOP: | BOTTOM: |
 |
|
 |
|
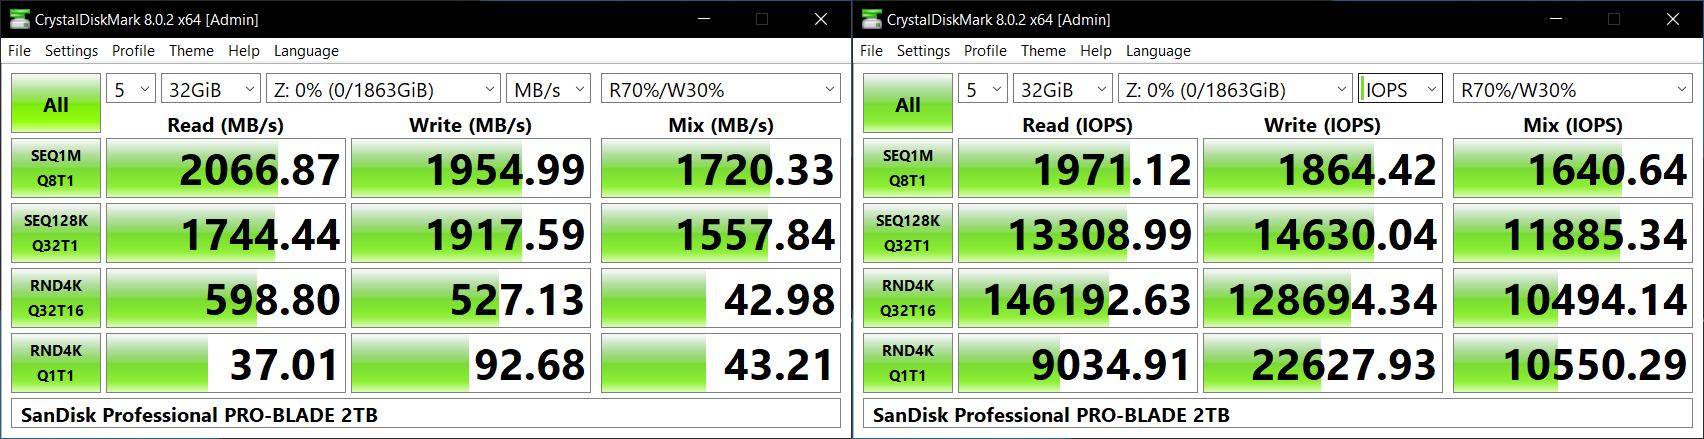
The 2TB version slightly lags the 4TB one for high queue depth sequential accesses, but the performance is hard to differentiate in regular use. The key aspect to note is the random access performance - essentially 1.5x to 2x of the performance of DRAM-less configurations (such as the Samsung T9 4TB which is also a bridge-based solution, and the Crucial X10 Pro which uses a DRAM-less native UFD controller).
AnandTech DAS Suite - Benchmarking for Performance Consistency
Our testing methodology for storage bridges / direct-attached storage units takes into consideration the usual use-case for such devices. The most common usage scenario is transfer of large amounts of photos and videos to and from the unit. Other usage scenarios include the use of the unit as a download or install location for games and importing files directly from it into a multimedia editing program such as Adobe Photoshop. Some users may even opt to boot an OS off an external storage device.
The AnandTech DAS Suite tackles the first use-case. The evaluation involves processing five different workloads:
- AV: Multimedia content with audio and video files totalling 24.03 GB over 1263 files in 109 sub-folders
- Home: Photos and document files totalling 18.86 GB over 7627 files in 382 sub-folders
- BR: Blu-ray folder structure totalling 23.09 GB over 111 files in 10 sub-folders
- ISOs: OS installation files (ISOs) totalling 28.61 GB over 4 files in one folder
- Disk-to-Disk: Addition of 223.32 GB spread over 171 files in 29 sub-folders to the above four workloads (total of 317.91 GB over 9176 files in 535 sub-folders)
Except for the 'Disk-to-Disk' workload, each data set is first placed in a 29GB RAM drive, and a robocopy command is issue to transfer it to the external storage unit (formatted in exFAT for flash-based units, and NTFS for HDD-based units).
robocopy /NP /MIR /NFL /J /NDL /MT:32 $SRC_PATH $DEST_PATH
Upon completion of the transfer (write test), the contents from the unit are read back into the RAM drive (read test) after a 10 second idling interval. This process is repeated three times for each workload. Read and write speeds, as well as the time taken to complete each pass are recorded. Whenever possible, the temperature of the external storage device is recorded during the idling intervals. Bandwidth for each data set is computed as the average of all three passes.
The 'Disk-to-Disk' workload involves a similar process, but with one iteration only. The data is copied to the external unit from the CPU-attached NVMe drive, and then copied back to the internal drive. It does include more amount of continuous data transfer in a single direction, as data that doesn't fit in the RAM drive is also part of the workload set.
It can be seen that there is no significant gulf in the numbers between the different units. The PRO-BLADE TRANSPORT configurations come out on top in a lot of the benchmarks, and the SanDisk Extreme PRO v2 in others. In workload components where neither are on top, the numbers for the PSSD on top are within the run-to-run variations seen for the TRANSPORT configurations. For all practical purposes, the casual user will notice no difference between the different bridge-based PSSDs in the course of normal usage. However, power users may want to dig deeper to understand the limits of each device. To address this concern, we also instrumented our evaluation scheme for determining performance consistency.
Performance Consistency
Aspects influencing the performance consistency include SLC caching and thermal throttling / firmware caps on access rates to avoid overheating. This is important for power users, as the last thing that they want to see when copying over 100s of GB of data is the transfer rate going down to USB 2.0 speeds.
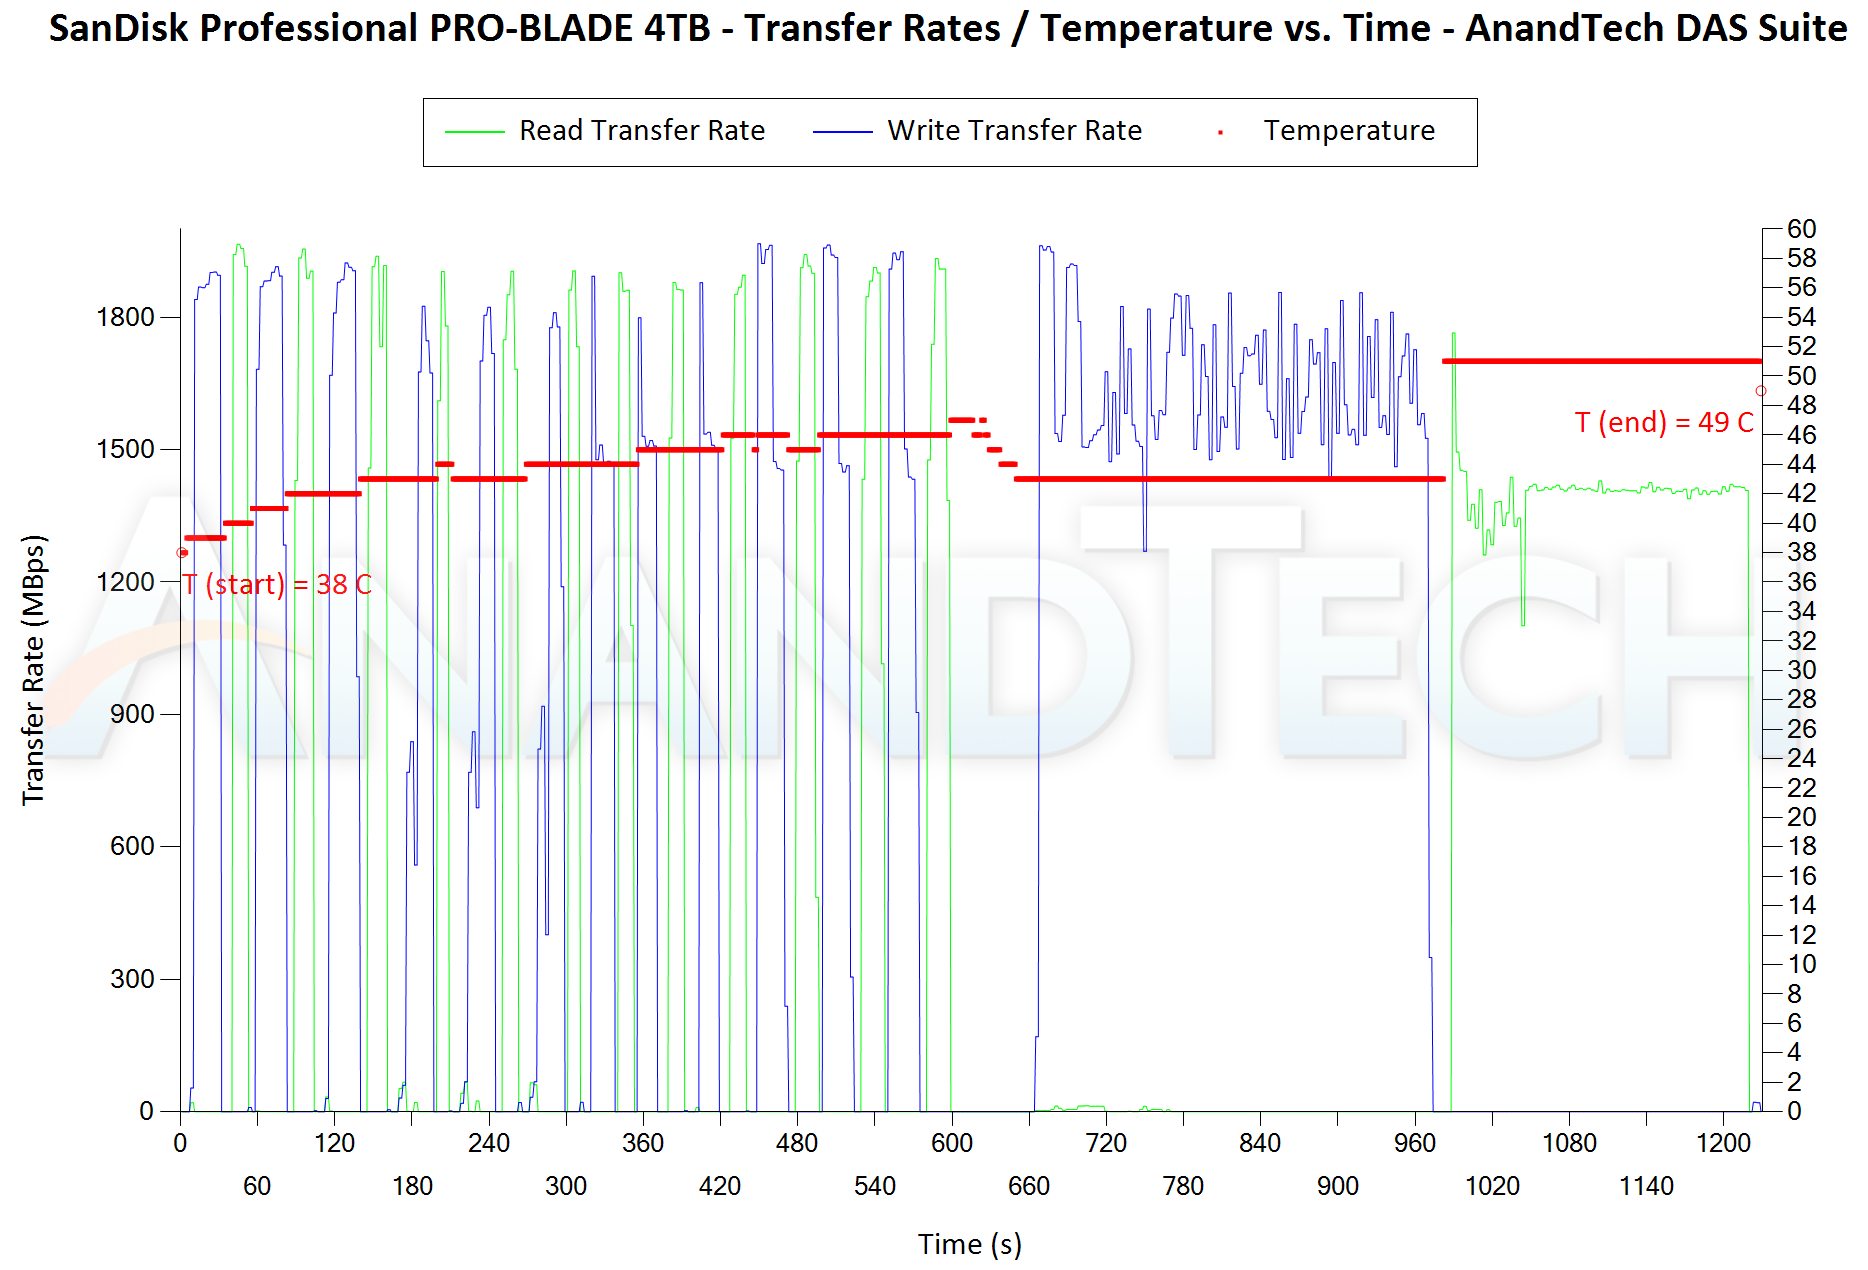
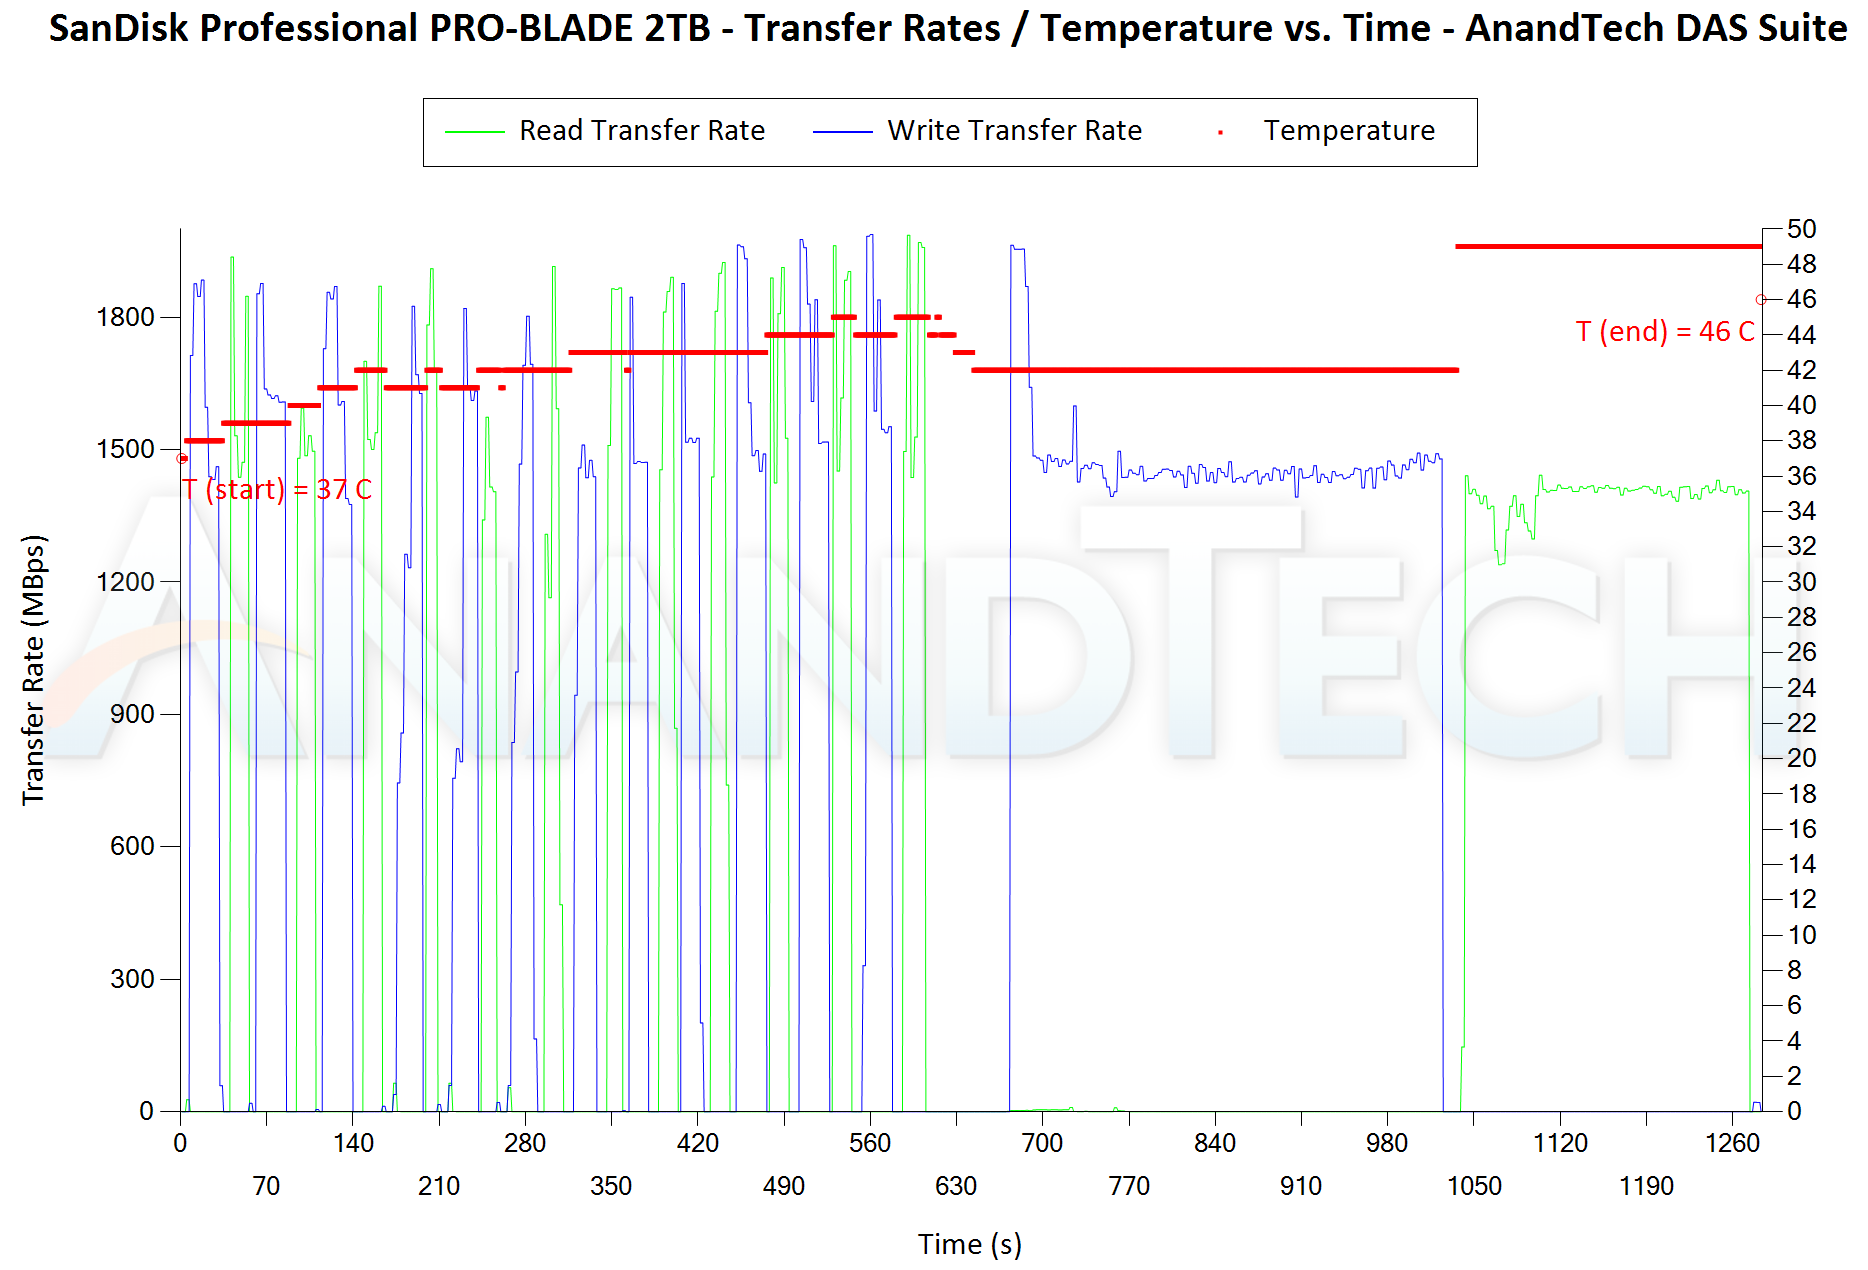
In addition to tracking the instantaneous read and write speeds of the DAS when processing the AnandTech DAS Suite, the temperature of the drive was also recorded. In earlier reviews, we used to track the temperature all through. However, we have observed that SMART read-outs for the temperature in NVMe SSDs using USB 3.2 Gen 2 bridge chips end up negatively affecting the actual transfer rates. To avoid this problem, we have restricted ourselves to recording the temperature only during the idling intervals. The graphs below present the recorded data.
| AnandTech DAS Suite - Performance Consistency | |
| TOP: | BOTTOM: |
 |
|
 |
|
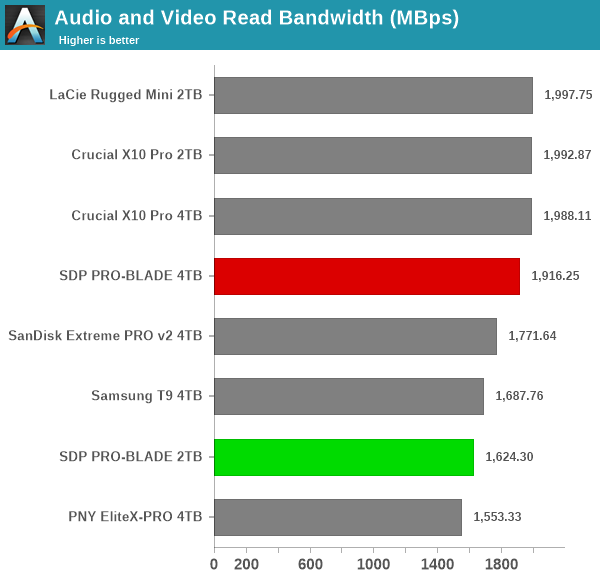
The first three sets of writes and reads correspond to the AV suite. A small gap (for the transfer of the video suite from the internal SSD to the RAM drive) is followed by three sets for the Home suite. Another small RAM-drive transfer gap is followed by three sets for the Blu-ray folder. This is followed up with the large-sized ISO files set. Finally, we have the single disk-to-disk transfer set. Both TRANSPORT configurations are able to sustain a minimum of 1500 MBps across all write components - something that none of the other PSSDs in the competition set was able to do (the SanDisk Extrem PRO v2 included). The maximum recorded temperature was only 51C for the 4TB version and 49C for the 2TB one.
PCMark 10 Storage Bench - Real-World Access Traces
There are a number of storage benchmarks that can subject a device to artificial access traces by varying the mix of reads and writes, the access block sizes, and the queue depth / number of outstanding data requests. We saw results from two popular ones - ATTO, and CrystalDiskMark - in a previous section. More serious benchmarks, however, actually replicate access traces from real-world workloads to determine the suitability of a particular device for a particular workload. Real-world access traces may be used for simulating the behavior of computing activities that are limited by storage performance. Examples include booting an operating system or loading a particular game from the disk.
PCMark 10's storage bench (introduced in v2.1.2153) includes four storage benchmarks that use relevant real-world traces from popular applications and common tasks to fully test the performance of the latest modern drives:
- The Full System Drive Benchmark uses a wide-ranging set of real-world traces from popular applications and common tasks to fully test the performance of the fastest modern drives. It involves a total of 204 GB of write traffic.
- The Quick System Drive Benchmark is a shorter test with a smaller set of less demanding real-world traces. It subjects the device to 23 GB of writes.
- The Data Drive Benchmark is designed to test drives that are used for storing files rather than applications. These typically include NAS drives, USB sticks, memory cards, and other external storage devices. The device is subjected to 15 GB of writes.
- The Drive Performance Consistency Test is a long-running and extremely demanding test with a heavy, continuous load for expert users. In-depth reporting shows how the performance of the drive varies under different conditions. This writes more than 23 TB of data to the drive.
Despite the data drive benchmark appearing most suitable for testing direct-attached storage, we opt to run the full system drive benchmark as part of our evaluation flow. Many of us use portable flash drives as boot drives and storage for Steam games. These types of use-cases are addressed only in the full system drive benchmark.
The Full System Drive Benchmark comprises of 23 different traces. For the purpose of presenting results, we classify them under five different categories:
- Boot: Replay of storage access trace recorded while booting Windows 10
- Creative: Replay of storage access traces recorded during the start up and usage of Adobe applications such as Acrobat, After Effects, Illustrator, Premiere Pro, Lightroom, and Photoshop.
- Office: Replay of storage access traces recorded during the usage of Microsoft Office applications such as Excel and Powerpoint.
- Gaming: Replay of storage access traces recorded during the start up of games such as Battlefield V, Call of Duty Black Ops 4, and Overwatch.
- File Transfers: Replay of storage access traces (Write-Only, Read-Write, and Read-Only) recorded during the transfer of data such as ISOs and photographs.
PCMark 10 also generates an overall score, bandwidth, and average latency number for quick comparison of different drives. The sub-sections in the rest of the page reference the access traces specified in the PCMark 10 Technical Guide.
Booting Windows 10
The read-write bandwidth recorded for each drive in the boo (that is the tag given in the official PCMark technical guide) access trace is presented below.
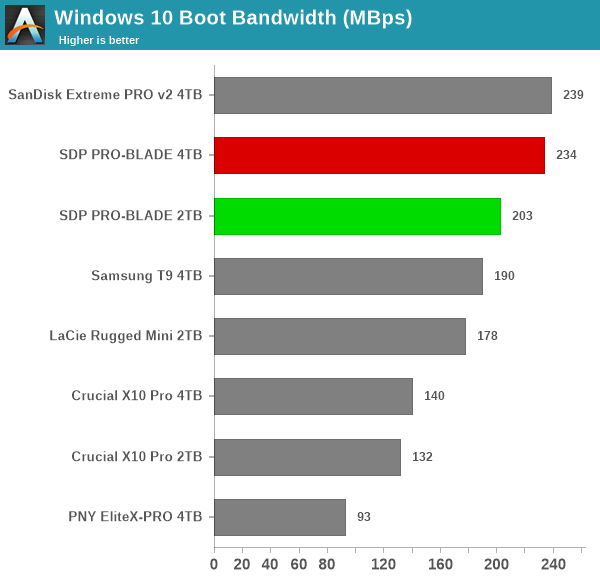
PSSDs using DRAM for the FTL usually perform better in workloads involving large number of random small-sized accesses like OS booting. So, it is no surprise that the TRANSPORT configurations along with the SanDisk Extreme PRO v2 take up the top three spots.
Creative Workloads
The read-write bandwidth recorded for each drive in the sacr, saft, sill, spre, slig, sps, aft, exc, ill, ind, psh, and psl access traces are presented below.
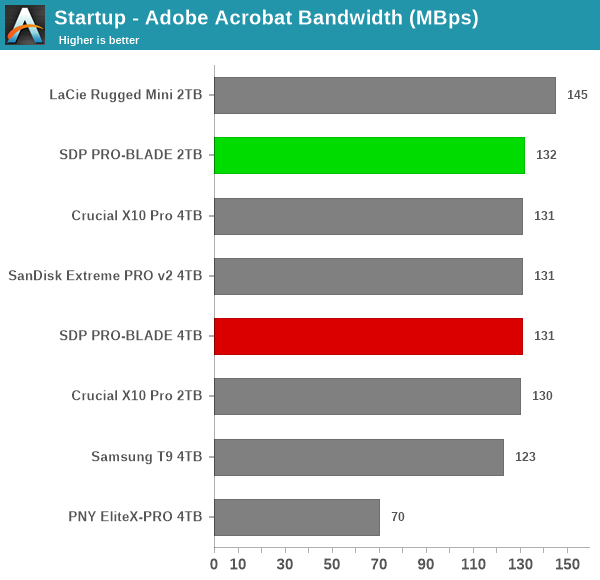
The LaCie Rugged Mini (despite its native UFD design) has its firmware optimized for certain creative workloads and comes out on top in a few. For the vast majority of the components, the three DRAM-enabled PSSDs take up the three top spots.
Office Workloads
The read-write bandwidth recorded for each drive in the exc and pow access traces are presented below.
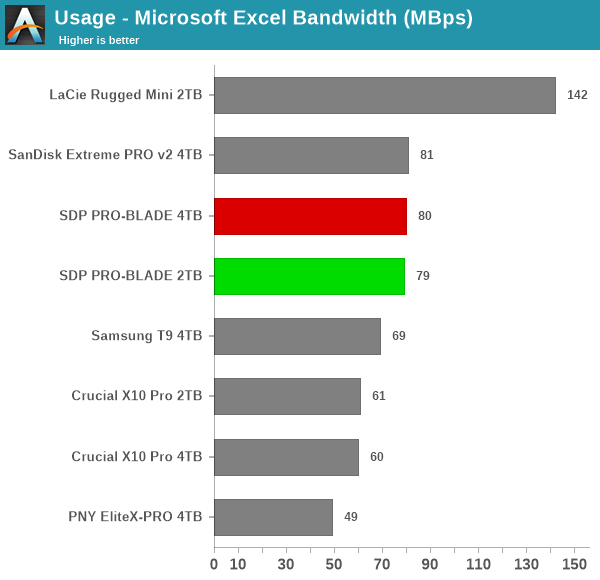
The Rugged Mini is on top for spreadsheet workloads, but the slides components sees the DRAM-enabled PSSDs from Western Digital taking up the top spots.
Gaming Workloads
The read-write bandwidth recorded for each drive in the bf, cod, and ow access traces are presented below.
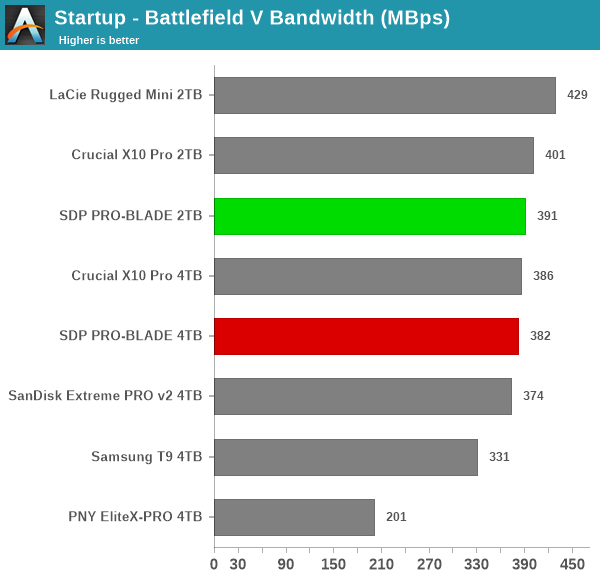
Gaming workloads are read-heavy and deal mostly with large-sized files. Under such conditions, most of the considered PSSDs that are able to saturate the 20 Gbps bus in the artificial tests perform similarly.
Files Transfer Workloads
The read-write bandwidth recorded for each drive in the cp1, cp2, cp3, cps1, cps2, and cps3 access traces are presented below.
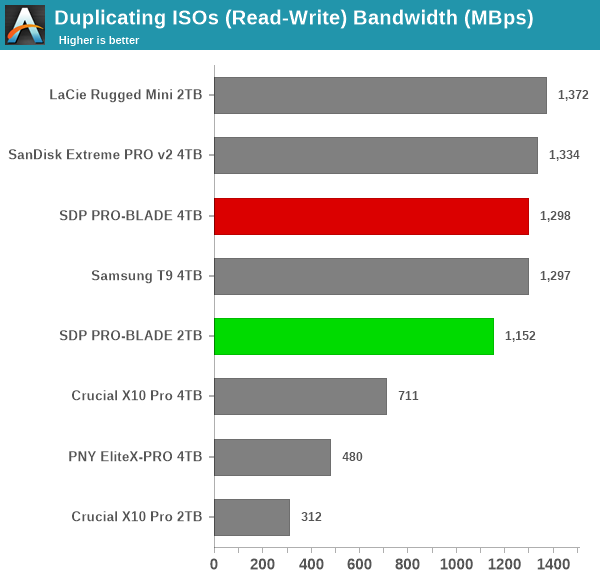
The results in these are largely reflective of what was observed in the AnandTech DAS Suite, and the same analysis holds true here with different PSSDs trading places for different components. The DRAM-enabled PSSDs hold a slight edge across the board.
Overall Scores
PCMark 10 reports an overall score based on the observed bandwidth and access times for the full workload set. The score, bandwidth, and average access latency for each of the drives are presented below.
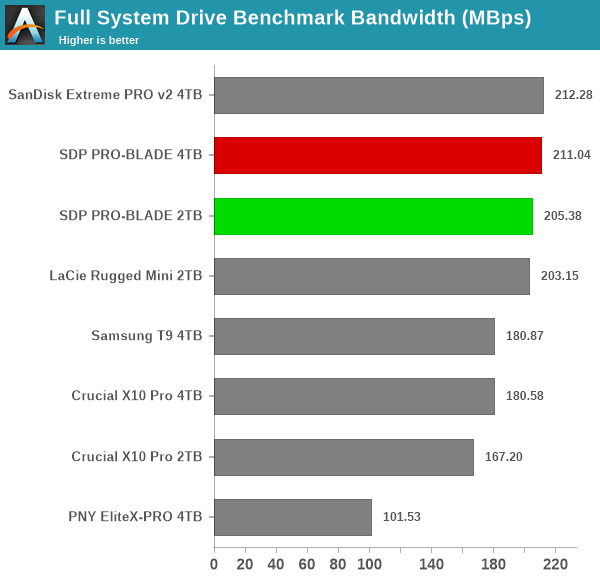
It is no surprise that the three PSSDs incorporating a NVMe SSD using DRAM for the flash translation layer take up the top three spots, and there is not much separating them in terms of either bandwidth or latency.


13 Comments
View All Comments
PeachNCream - Thursday, March 7, 2024 - link
Ecosystem. Good job Western Digital! </sarcasm>twotwotwo - Thursday, March 7, 2024 - link
:/ Yeah. An open hot-pluggable passive adapter/port standard for m.2 could be neat, but this isn't that.Meanwhile, there is an "ecosystem" of regular enclosures covering lots of use cases--form factors, capacities, cost/perf balance, etc.--and not all from one vendor. (There are incredibly cute 2230/2242 enclosures sold as pocketable little squares or chunky USB sticks!)
This was introduced 2022 and the market is so specific I can't imagine it's sold wildly. Maybe making the connector free for others to use to create more of a true 'ecosystem' would help them sell more on net?
twotwotwo - Thursday, March 7, 2024 - link
On the "what if it *were* a standard" theme, 'm.2 2230 in a trenchcoat' would probably get the attention of users of CF Express, SD Express, etc. if it were to be a thing with multiple vendors participating, etc.Solid performance in a basic config (one lane of PCIe3), potentially much faster when all the oomph is used (four lanes of PCIe4, maybe cooling), and most of the pieces are already being manufactured today.
Kamen Rider Blade - Thursday, March 7, 2024 - link
Or we can use 1.8" HDD/SSD form factor & U.3 connector.Novel Idea, I know.
TheinsanegamerN - Thursday, March 7, 2024 - link
Unlike 1.8" HDDS (literally do those even still exist?) or U.3 stuff, CFexpress already exists and has existing readers.twotwotwo - Thursday, March 7, 2024 - link
I mean, first, yes, it's inherently sort of silly to imagine new standards in a random thread, but, you know, we might as well have fun.The tradeoff vs. CFExpress would be cost/GB and cost/performance (look at 1TB CFExpress card specs and price vs. 1TB 2230) at the cost of chunkiness and, I'm guessing, power. And compared to U.2/3 1.8", you're building it around commodity drives in their form factor.
The story this links back to actually says the connector's "custom, but not proprietary," as if others *could* make compatible stuff. Would be neat if some did!
Kamen Rider Blade - Friday, March 8, 2024 - link
CFexpress Type-B is good for 2x NAND Flash Packages on both sides + Controller and/or 1x DRAM package.CFexpress Type-A is good for 1x NAND Flash Package on one side & Controller on other side.
A 1.8 HDD/SSD form factor is good for 16x NAND Flash Packages in total, 8x on each side of the PCB with the controller in the center and 1x DRAM Package on the other side of the controller in the center.
LiKenun - Saturday, March 9, 2024 - link
And let’s not neglect to remember type C. It’s dimensions 54.0 mm × 74.0 mm × 4.8 mm are almost the same as the 1.8″ form factor (54.0 mm × 71.0 mm × 5.0 mm) while being designed for removability.Kamen Rider Blade - Sunday, March 10, 2024 - link
I think CFx Type-C is dead in the water compared to 1.8" HDD/SSD form factor.Just like "Dual-Link HDMI" was never ever implemented.
meacupla - Thursday, March 7, 2024 - link
I don't understand why they had to go out and design a new connector?What was wrong with EDSFF E1.S?
And before you ask, there are EDSFF to M.2 NVMe 2280 adapters. They are pretty cheap too.