SanDisk Extreme 900 USB 3.1 Gen 2 Portable SSD Review
by Ganesh T S on April 11, 2016 8:00 AM ESTSynthetic Benchmarks - ATTO and CrystalDiskMark
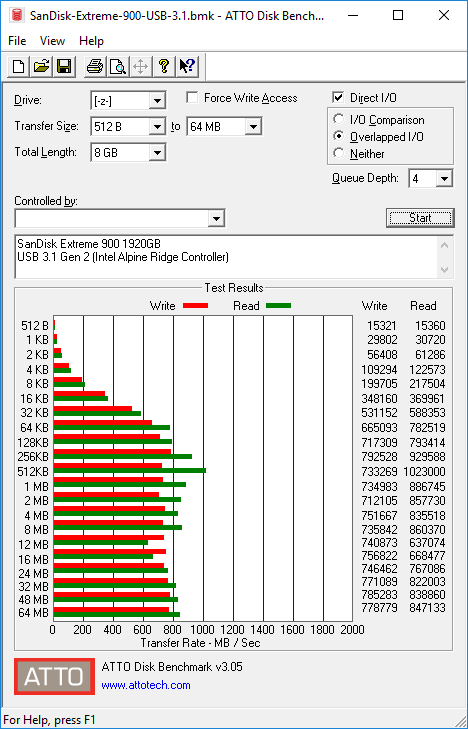
SanDisk claims read and write speeds of 850MBps using ASMedia's USB 3.1 Gen 2 host controller. Our results with the Intel Alpine Ridge controller, didn't match up on the write side, but ATTO's read numbers definitely measured up. Unfortunately, these access traces are not very common in real-life scenarios.
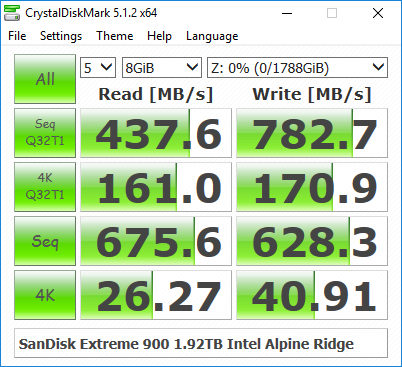
CrystalDiskMark, despite being a canned benchmark, provides a better estimate of the performance range with a selected set of numbers. As evident from the screenshot below, the performance can dip to as low as 26 MBps for random 4K accesses with low queue depths.
Benchmarks - robocopy and PCMark 8 Storage Bench
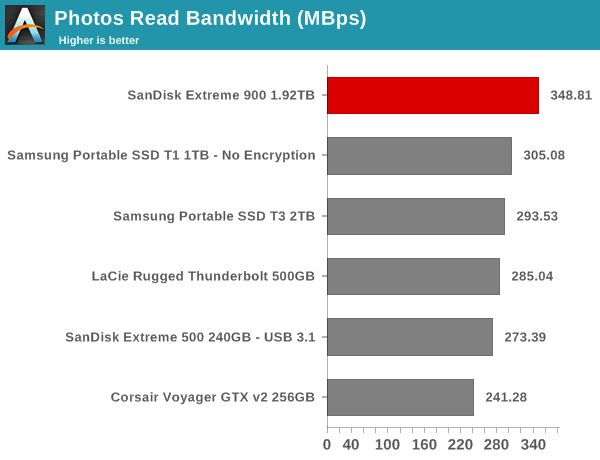
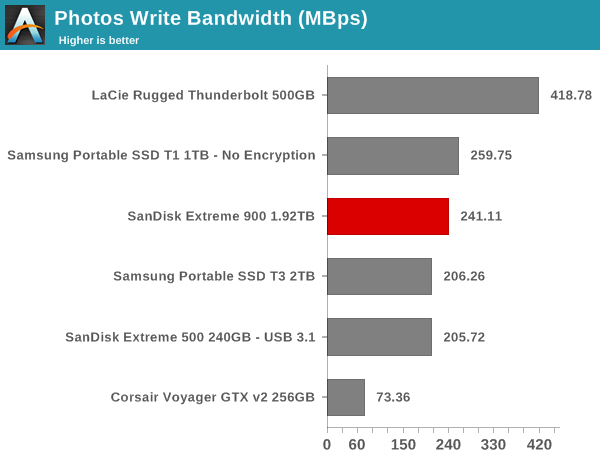
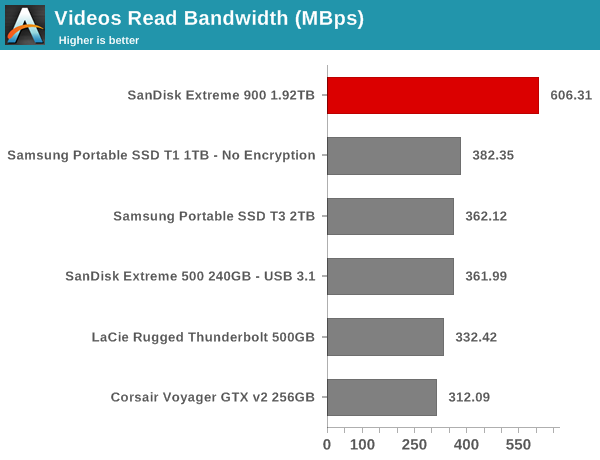
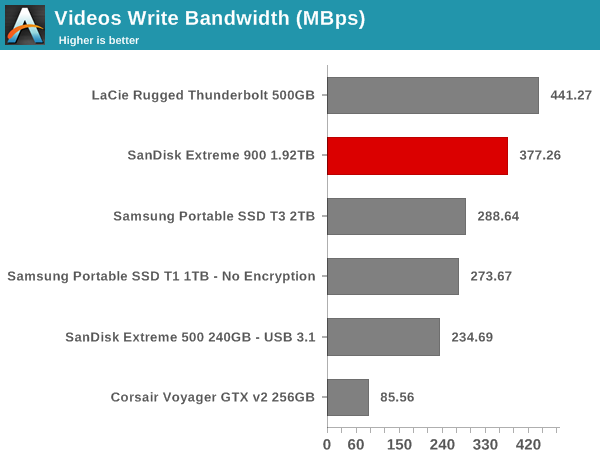
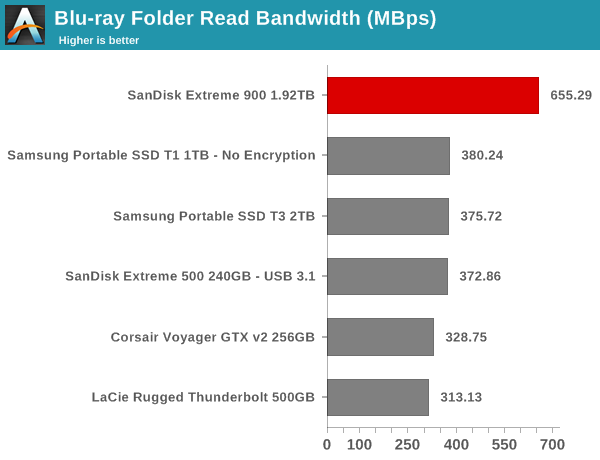
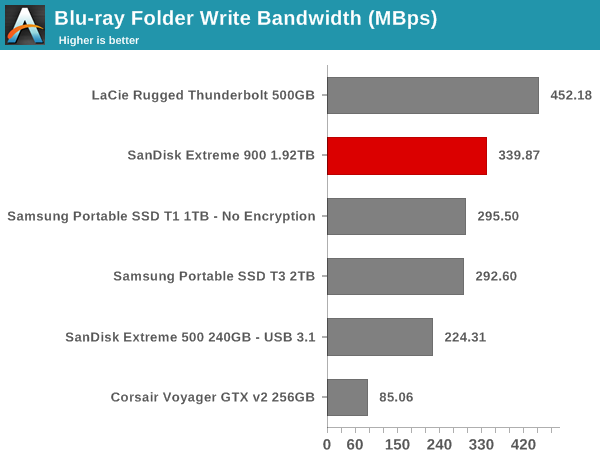
Our testing methodology for DAS units also takes into consideration the usual use-case for such devices. The most common usage scenario is transfer of large amounts of photos and videos to and from the unit. The minor usage scenario is importing files directly off the DAS into a multimedia editing program such as Adobe Photoshop.
In order to tackle the first use-case, we created three test folders with the following characteristics:
- Photos: 15.6 GB collection of 4320 photos (RAW as well as JPEGs) in 61 sub-folders
- Videos: 16.1 GB collection of 244 videos (MP4 as well as MOVs) in 6 sub-folders
- BR: 10.7 GB Blu-ray folder structure of the IDT Benchmark Blu-ray (the same that we use in our robocopy tests for NAS systems)
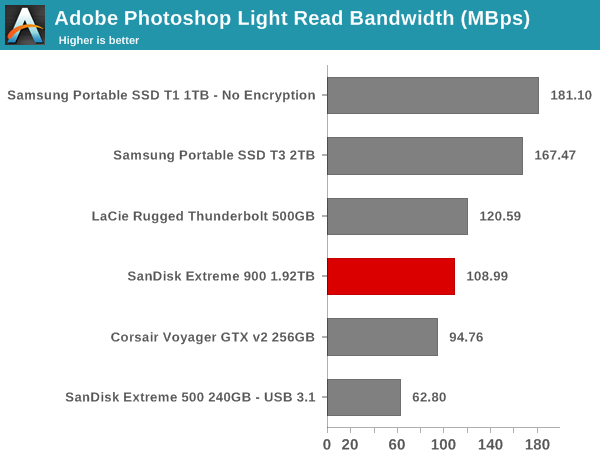
For the second use-case, we take advantage of PC Mark 8's storage bench. The storage workload involves games as well as multimedia editing applications. The command line version allows us to cherry-pick storage traces to run on a target drive. We chose the following traces.
- Adobe Photoshop (Light)
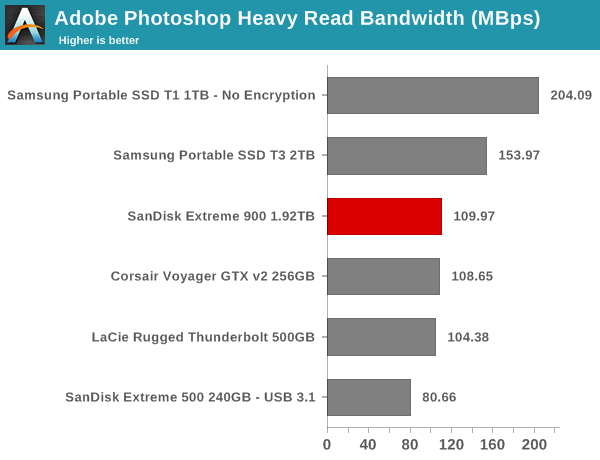
- Adobe Photoshop (Heavy)
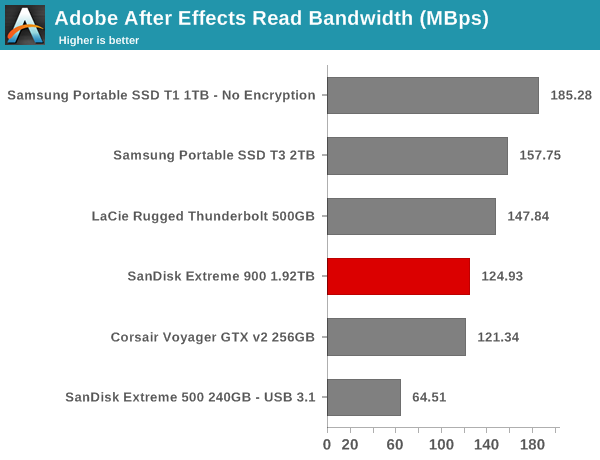
- Adobe After Effects
- Adobe Illustrator
Usually, PC Mark 8 reports time to complete the trace, but the detailed log report has the read and write bandwidth figures which we present in our performance graphs. Note that the bandwidth number reported in the results don't involve idle time compression. Results might appear low, but that is part of the workload characteristic. Note that the same testbed is being used for all DAS units. Therefore, comparing the numbers for each trace should be possible across different DAS units.

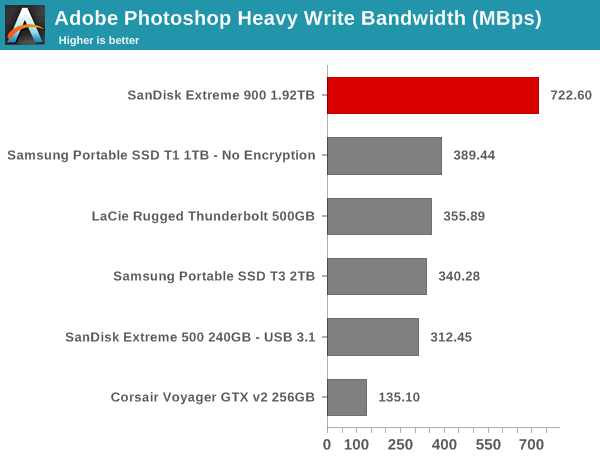
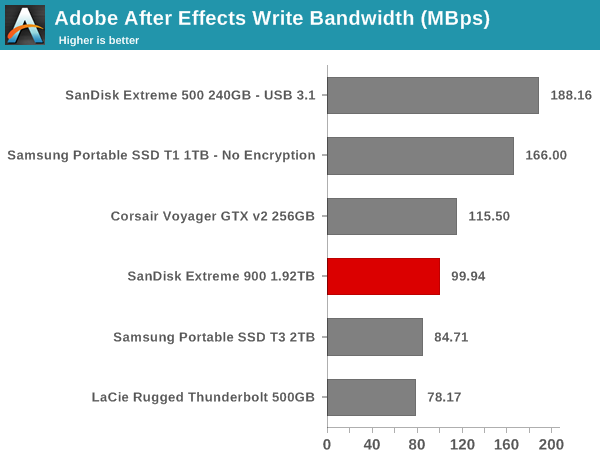
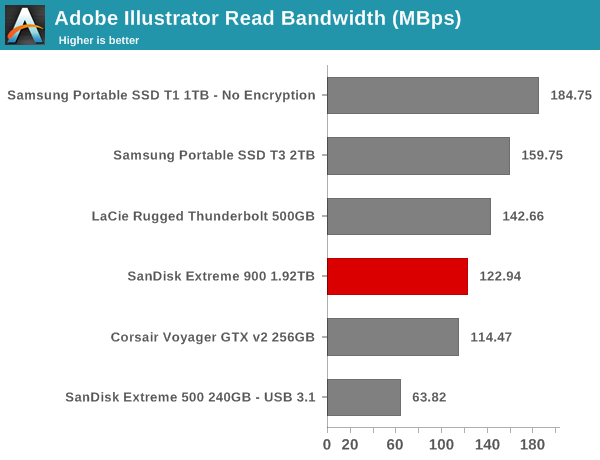
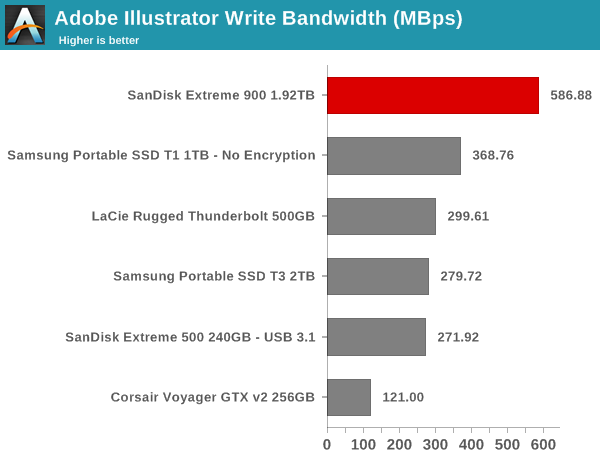
Certain access traces work heavily in favor of RAID 0 SSDs, but others end up with a run-of-the-mill performance. However, it can be said that the Extreme 900 works better than a USB 3.0 flash drive (SSD-based or otherwise) for most practical access traces.


31 Comments
View All Comments
MRFS - Saturday, April 16, 2016 - link
The SATA-IV standard should support a minimum clock rate of 8 GHz(to synchronize it with the 8G clock already supported by the PCIe 3.0 standard),
and it should also support the 128b/130b "jumbo frame" also in the PCIe 3.0 standard.
PCIe 4.0 will oscillate at 16 GHz, and SATA-V should also sync with that faster clock.
The fact that USB 3.1 increased the clock rate to 10G and adopted a 128b/132b jumbo frame
is proof that the SATA standards group have morphed into snails marooned on dry ice.