The Snapdragon 845 Performance Preview: Setting the Stage for Flagship Android 2018
by Ryan Smith & Andrei Frumusanu on February 12, 2018 12:30 AM EST- Posted in
- Mobile
- Snapdragon
- Qualcomm
- Smartphones
- SoCs
- Snapdragon 845
System Performance
To see how the new CPUs and memory subsystem translate into more real system performance, we move onto more representative tests such as PCMark. PCMark’s performance is affected by several factors: not only does raw performance of the hardware count but also we need to consider the individual system’s software stack. We’ve seen large differences between Android OS major versions where the improvements of the Android Runtime can be directly visible in subtests such as the Writing test. Also a SoC’s DVFS schemes and schedulers can have huge impacts on “performance-latency”, meaning how fast the CPUs can ramp up a workload. This directly translates in a lot more performance in several of PCMark’s subtests as in the default settings none of the tests actually represent the pure performance of the CPU if it were locked at maximum frequency on the performance cores. The results of the tests are also overall a good representation of “snappiness” of a device.
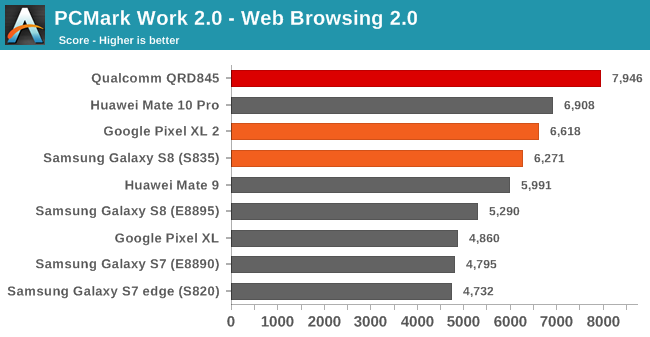
In the web browsing test the Snapdragon 845 QRD manages to outpace the Pixel 2 XL by 20%. Here we’re also looking at performance across devices with different OS versions. The Google devices are running Android 8.1 while the Samsung devices were tested with Android 7.0. The Mate 10 Pro runs Android 8.0 while the Mate 9 still had 7.0. The Qualcomm QRD we tested ran Android 8.0.
Again the performance increase over Snapdragon 835 devices isn’t all that great. DynamiQ allows for far more efficient thread transitions between the CPU cores and subsequently I expected Qualcomm to take advantage of this through more aggressive scheduling resulting in more than just a 20% increase. The difference between the Mate 9 and Mate 10 here is a good example of what a software configuration change can bring in terms of performance (both devices employ same performance CPU configurations). Samsung’s Exynos’ SoCs still use GTS scheduling and have non-optimal performance-latency resulting in bad scores, amplified by the fact that Samsung’s memory performance is also underwhelming when compared to the Snapdragon and Kirin SoCs.
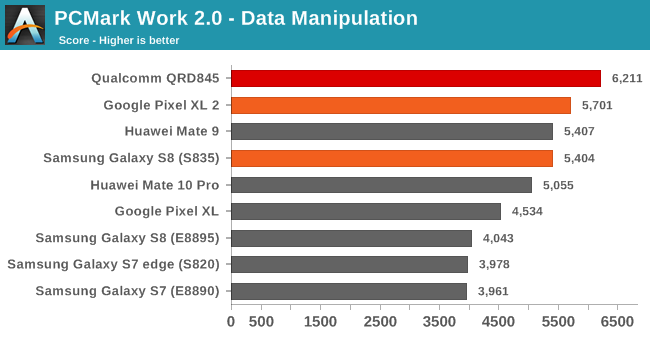
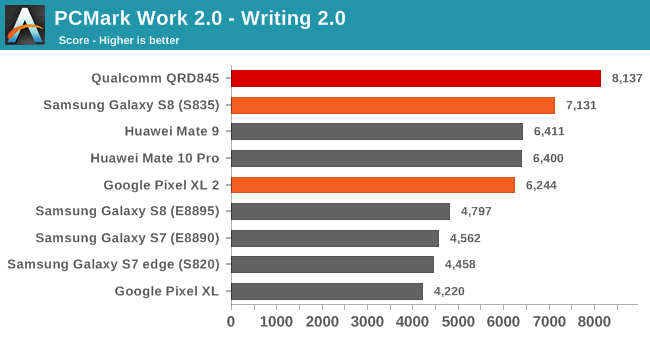
The Data Manipulation and Writing 2.0 tests make heavy use of the Android runtime and APIs and also a very memory latency sensitive. Between the best showings of the Snapdragon 835 variant of the S8 and the Pixel 2 XL in each respective benchmark, the Snapdragon QRD845 showed conservative increases of 8 to 14%. The Exynos SoCs lacklustre performance is again hampered by software and by bad memory performance.
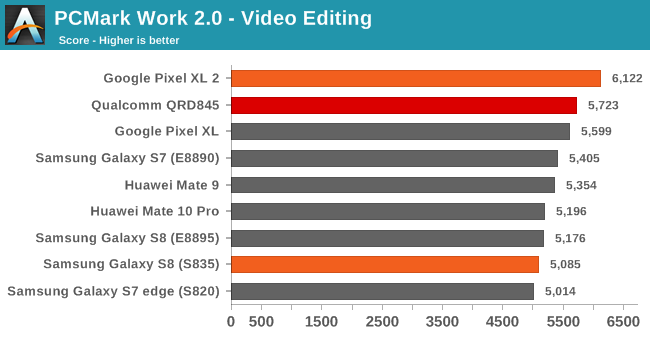
The video editing test is PCMark’s weak-point as it’s bottlenecked by things such as OS API overhead, and why we see tight grouping of performance results across a large range of SoCs. The Snapdragon 845 ends up high, but below the Pixel 2 XL. I would not put much weight on the results of this test as they’re not necessarily representative. Futuremark claims that the test is a lot more sensitive in mid- and low-range devices which can exhibit performance issues.
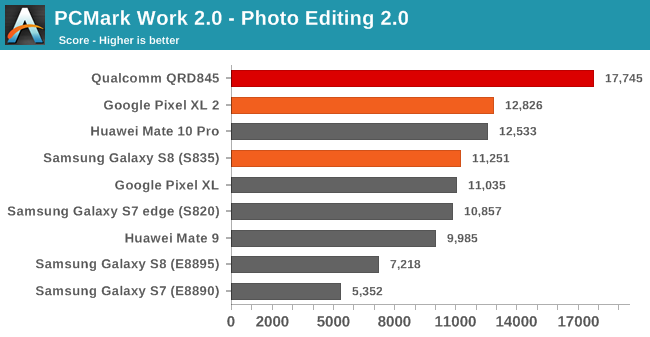
The photo editing test makes heavy use of Renderscript and use GPU acceleration to apply various effects on an image set. The QRD845 here shines as it’s able to showcase a 38% performance improvement over the Pixel 2 XL. Again the test not solely tests the raw performance of the system but also how optimized it is in terms of the software stack. This can be seen in the Kirin vs Exynos devices as Huawei’s phones vastly outperform Samsung’s devices in this test.
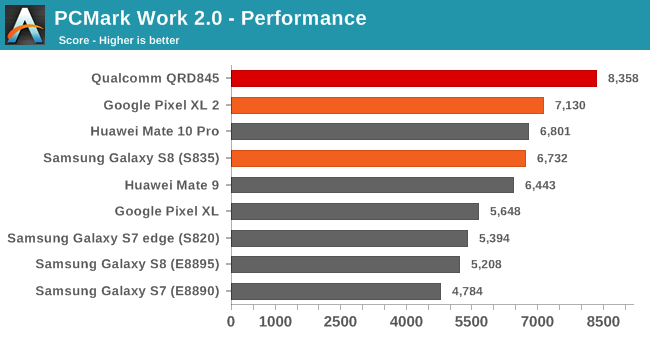
Overall PCMark’s performance score for the QRD845 increases by 17% over the Pixel 2 XL. Disregarding the video test, we see a similar scenario as in the synthetic tests as the new SoC’s CPU performance increases are lower than we had expected. Still the Snapdragon 845 is able to top the charts and should adequately power 2018’s flagship devices.
For 2018 we are reviewing our mobile benchmarking suite and altering some of the benchmarks we use. One of the changes in the way we benchmark devices is that we’re moving away from standalone browser and rather are benchmarking the OS’s WebView implementations. In general this seems to be a better choice for testing device experience as there is a lot of content that is being consumed via WebView windows. We also avoid the argument about different browser performance and since Google has now made WebView an updatable Play Store component we should also have valid comparisons older devices and systems. On the iOS side we do the same as we now benchmark browser tests within a WkWebView shell.
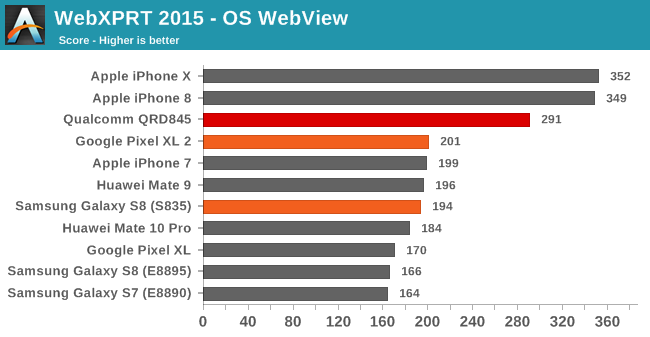
Starting off with WebXPRT 2015 for a last time before we’ll retire it in favour of WebXPRT 3, we see the QRD845 performing fantastically. Here the 44% performance increase over the Pixel 2 XL is a lot more in line with what we had expected of the new SoC. The QRD845 is even able to catch up a lot with Apple’s newest A11 and Monsoon cores in this test.
To keep up with the ever changing landscape of the developing web, we’re also retiring past JavaScript benchmarks in favour of a brand new and more representative benchmark developed by the WebKit team and welcomed by Google; Speedometer 2.0.
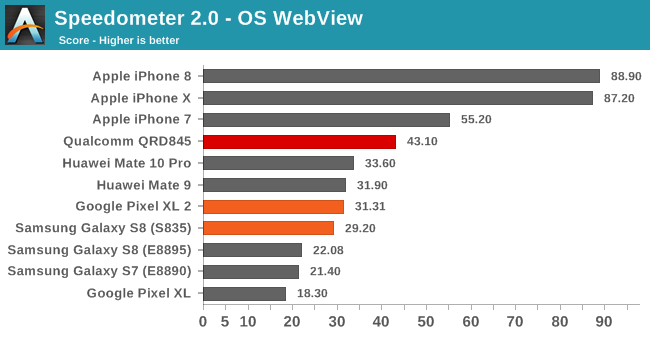
Here the Snapdragon 845 showcased another healthy performance increase of 37% over the Snapdragon 835 devices. Apple’s superior JavaScript performance can be attributed to a much faster and more optimized Nitro engine while Google’s V8 has only seen meagre improvements over the years. Notable is the Apple A11’s massive performance jump over the A10 – vastly increasing the distance to Android devices.


140 Comments
View All Comments
Eximorph - Sunday, February 18, 2018 - link
You should read a little before post comments. The speed of the gpu depends on the api Thats why apple change from open gl es to metal beacus metal is a low overhead so the performance is higher. And thats why when some one test a gpu have to do it under fair conditions and thats where 3Dmark is good. And like you can see even the adreno 530 on the same api have a better performance than the A11 gpu. Even on t-rex onscreen the performance of the new A11 gpu is the same has the adreno 530. 59 for A11, 60 for the adreno 530 on the oneplus 3t. one more time, apple today day Is almost 3 years behind. Vulkan is have been you in some game today day but you want to know whats the funny thing here, vulkan is on version 1 and offer the same persomance has metal and metal is on version 2 hahahah.Ratman6161 - Thursday, February 15, 2018 - link
"Good on Qualcomm for catching up but still 6 months to a year behind"I guess it depends how you define behind. With my trusty old (and completely paid for) Note 5, I have had a phone since 2015 that is plenty fast for everything I do. Do its all just academic for me. The days when I needed a faster CPU are long since over.
SoC lover - Friday, March 2, 2018 - link
A-11 bionic is just only 6 cores but still a flagship and powerful while snapdragon 835/845 has 8 cores so im thinking what if apple make a new chipset with 8 cores thats would be soo powerfulmfaisalkemal - Monday, February 12, 2018 - link
i think why anandtech got that score because of the device run on cold condition. score from futuremark got from normal condition.BenSkywalker - Monday, February 12, 2018 - link
We really should tip our hats to Qualcomm's legal team for this one. It is amazing their engineers have managed to push out a GPU that can edge out the Tegra X1 a mere three years after it came out.Slingshot Ex- 5360 graphics on a three year old SoC. Really shows how what truly matters in this market is top tier lawyers, and some fourth tier engineers.
Andrei Frumusanu - Monday, February 12, 2018 - link
One uses ~12 watts and the other uses ~4W, great comparison there.BenSkywalker - Monday, February 12, 2018 - link
Two things, one is that your power numbers are going to have to be sourced, the highest number I could ever find was 10 watts(and that was using a UE4 torture test). The only power draw numbers I could find for Manhattan had is sucking down a whopping 1.51 watts for the GPU(just the GPU and clocked to match some crappy Apple SoC's performance).https://www.anandtech.com/show/8811/nvidia-tegra-x...
Second thing- 20nm vs 10nm. On an engineering basis, this is a sad part. Qualcomm's legal posturing is the only reason they are remotely viable.
We are being held back to a staggering degree because of Qualcomm's strong arm tactics. The performance numbers speak for themselves, they are years behind.
Andrei Frumusanu - Monday, February 12, 2018 - link
That's the power on a Shield TV at maximum performance; source me. You're claiming that QC only reached now performance level so it's only fair to compare power at that level.Qualcomm is the one far ahead, your conspiracy theories make no sense.
BenSkywalker - Monday, February 12, 2018 - link
You are comparing the power draw of an entire device to the SoC alone, and you are comparing a 20nm part to a 10nm part on your just plain wrong power numbers.I linked it- running Manhattan the x1's GPU was using less then half the power that the 845 was reporting- the comparison wasn't exactly fair as they weren't measuring the same thing, but it is closer to accurate then what you are trying to imply. Also, 20nm vs 10nm LPP- are you being intentionally obtuse here, or do you not have a clue what you are talking about whatsoever?
This part, at least on the GPU end, isn't just bad, it is pathetic. It can barely edge out a three year old SoC. It is a joke.
darkd - Monday, February 12, 2018 - link
The x1 by itself is a 10-12W TDP part. You can Google this easily. Qualcomm SoCs are 4-5W typically. Also note you are comparing power draw at 33 fps of a different benchmark that runs ~40% faster (Manhattan 3.0 vs. 3.1), which makes no sense.The x1 at peak can hit ~60 fps on Manhattan 3.0. The 835 from last year can also do that, but at 2-3x less power.
If you want to talk the ~33 fps on Manhattan 3.0 where the 1.5W you mentioned was measured, then the Adreno 430 can do that about 3 years ago. Because that's peak clocks for the 430 it would likely be using 2+ W GPU power, which is more. The x1 was more power efficient than the 430, congrats. It hasn't been since then, however, as Qualcomm improved their Manhattan score 60-70% in 530. All of these number are easily obtained on gfxbench.com.
And I dunno what legal study you've done, but to imply Qualcomm lawyers can keep OEMs from using competitor SoCs is completely unfounded. Many of them have and do use other SoCs. They tend not to use Nvidia for mobile anymore, however, as the recent Nvidia parts all have too high a TDP.