The AMD Ryzen 7 7800X3D Review: A Simpler Slice of V-Cache For Gaming
by Gavin Bonshor on April 5, 2023 9:00 AM EST- Posted in
- CPUs
- AMD
- Zen 4
- AM5
- Ryzen 7000
- 3D V-Cache
- Ryzen 7 7800X3D
CPU Benchmark Performance: Power And Office
Our previous sets of ‘office’ benchmarks have often been a mix of science and synthetics, so this time we wanted to keep our office section purely on real-world performance. We've also incorporated our power testing into this section too.
The biggest update to our Office-focused tests for 2023 and beyond include UL's Procyon software, which is the successor to PCMark. Procyon benchmarks office performance using Microsoft Office applications, as well as Adobe's Photoshop/Lightroom photo editing software, and Adobe Premier Pro's video editing capabilities. Due to issues with UL Procyon and the video editing test, we haven't been able to properly run these, but once we identify a fix with UL, we will re-test each chip.
We are using DDR5 memory on the Ryzen 7 78000X3D and the other Ryzen 7000 series we've tested. This also includes Intel's 13th and 12th Gen processors. We tested the aforementioned platforms with the following settings:
- DDR5-5600B CL46 - Intel 13th Gen
- DDR5-5200 CL44 - Ryzen 7000
- DDR5-4800 (B) CL40 - Intel 12th Gen
All other CPUs such as Ryzen 5000 and 3000 were tested at the relevant JEDEC settings as per the processor's individual memory support with DDR4.
Power
The nature of reporting processor power consumption has become, in part, a bit of a nightmare. Historically the peak power consumption of a processor, as purchased, is given by its Thermal Design Power (TDP, or PL1). For many markets, such as embedded processors, that value of TDP still signifies the peak power consumption. For the processors we test at AnandTech, either desktop, notebook, or enterprise, this is not always the case.
Modern high-performance processors implement a feature called Turbo. This allows, usually for a limited time, a processor to go beyond its rated frequency. Exactly how far the processor goes depends on a few factors, such as the Turbo Power Limit (PL2), whether the peak frequency is hard coded, the thermals, and the power delivery. Turbo can sometimes be very aggressive, allowing power values 2.5x above the rated TDP.
AMD and Intel have different definitions for TDP that are, broadly speaking, applied the same. The difference comes from turbo modes, turbo limits, turbo budgets, and how the processors manage that power balance. These topics are 10000-12000 word articles in their own right, and we’ve got a few articles worth reading on the topic.
- Why Intel Processors Draw More Power Than Expected: TDP and Turbo Explained
- Talking TDP, Turbo and Overclocking: An Interview with Intel Fellow Guy Therien
- Reaching for Turbo: Aligning Perception with AMD’s Frequency Metrics
- Intel’s TDP Shenanigans Hurts Everyone
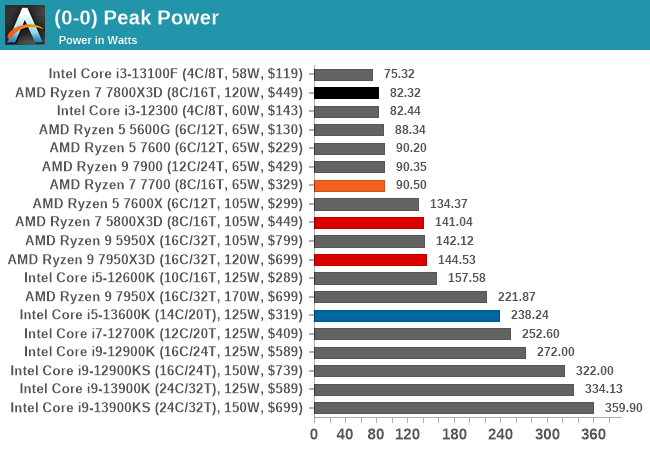
Ignoring the fact (only for a moment) that the Ryzen 7 7800X3D has a massive 96 MB of L3 cache that's packaged onto the die through their 3D V-Cache packaging technology, the power efficiency on display from an 8-core part is impressive. Even compared to AMD's own 6-core Ryzen 5 7600 with a base TDP of 65 W, the Ryzen 7 7800X3D pulled 82 W at full load, a whole 8 W watts less than the lower-powered chip. The Ryzen 7 7800X3D has a default TDP of 120 W, while the Power Package Tracking (PPT) allows up to 162 W of power to be drawn directly from the CPU socket.
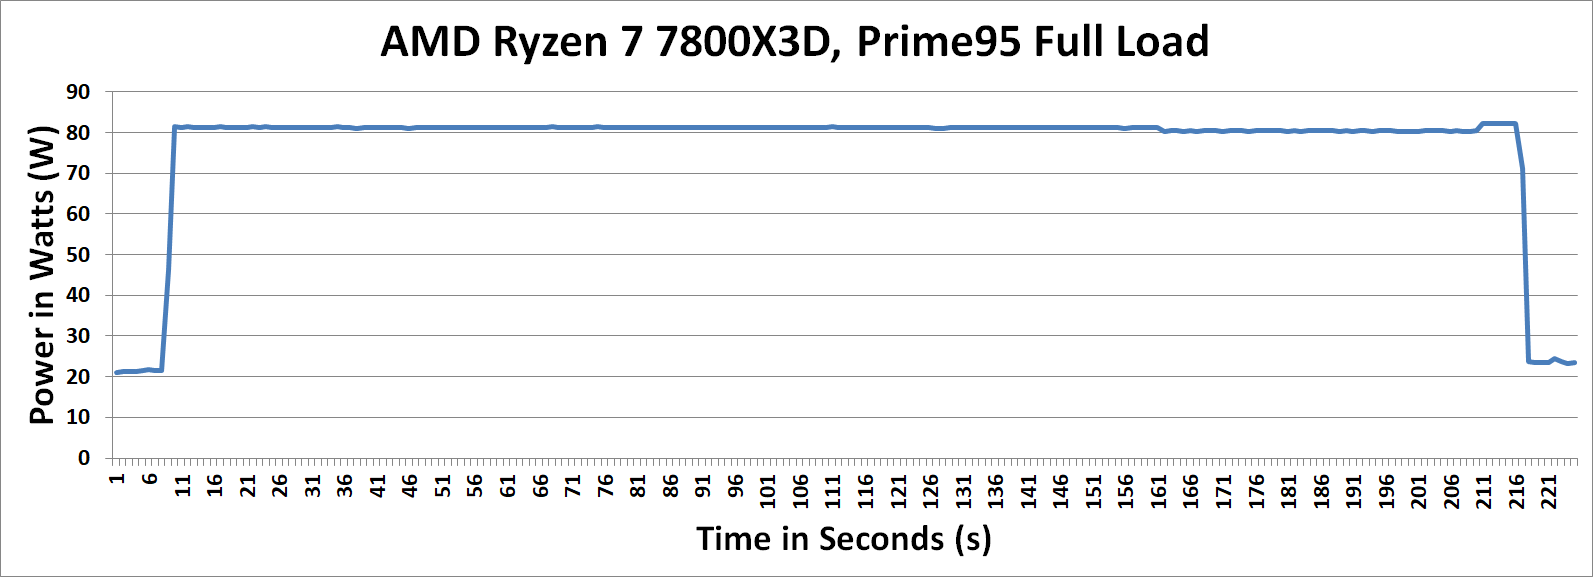
Going further into our analysis of the Ryzen 7 7800X3D, we can see that under Prime95 at full load, power is consistently delivered to the chip. Aside from the ramp up at the beginning of the test and the ramp down at the end, the Ryzen 7 7800X3D consistently drew between 80 W and 82.3 W for the duration of our test. This is at default settings, and there's a small chance that removing all of the PPT/EDC/TDC limits within AMD's Ryzen Master overclocking utility might allow for more power from the socket.
Any additional power is not likely to be a great amount, if any at all. This is because AMD's 3D V-Cache is quite sensitive to voltage. As a result of this, AMD has locked down ALL of the AMD Ryzen 7000X3D chips outside of Precision Boost Overdrive and applied AMD EXPO memory profiles, which is also technically overclocking.
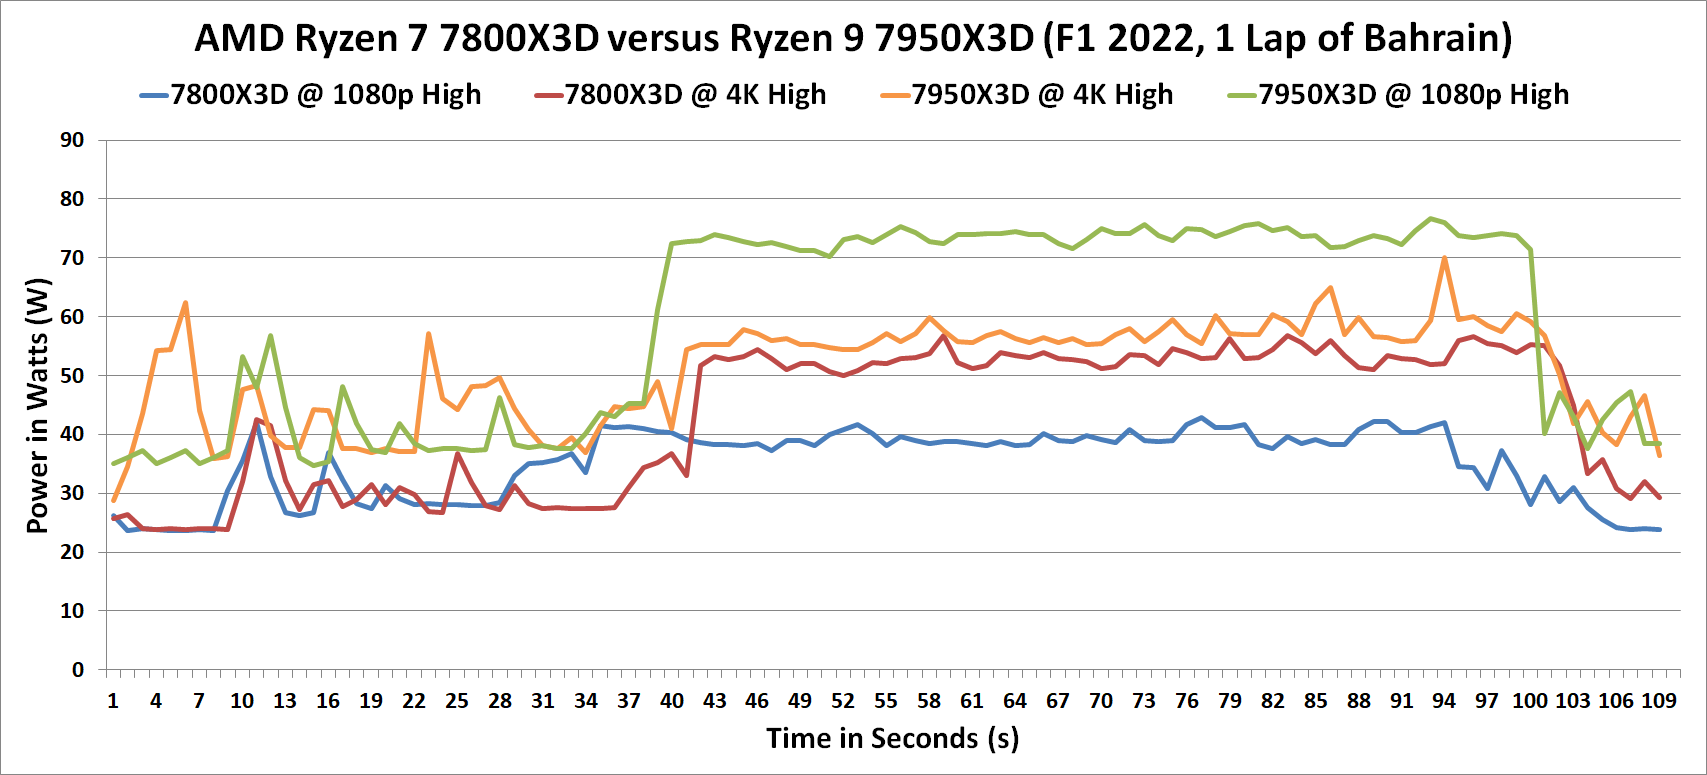
When we examined the performance of the AMD Ryzen 7 7800X3D during gaming, we noticed some intriguing power-related findings. We ran F1 2022 for one lap at high settings in both 1080p and 4K resolutions. Despite using the same settings, the Ryzen 7 7800X3D consumed more power at 4K compared to 1080p. During our 1080p testing, the CPU power varied between 30 and 42 watts throughout the lap. However, when we switched to 4K, the CPU power was higher, ranging between 32 and 58 Watts depending on the CPU load at different points of the lap.
When comparing the AMD Ryzen 7 7800X3D to the more expensive Ryzen 9 7950X3D, we noticed that the latter draws the most power when gaming at 1080p in F1 2022 with high settings. This is because 1080p is a resolution that relies more on CPU power than GPU power. During our testing, we observed power levels ranging between 71 and 76 watts on the 7950X3D at 1080p. However, when we switched to 4K, which is more GPU-dependent, the power draw on the 7950X ranged between 55 and 70 watts during our test run.
The behavior of the AMD Ryzen 7 7800X3D while gaming becomes even more intriguing and slightly strange, as it draws more power from the CPU at 4K than at 1080p. Although we cannot determine the exact reason for this, we do know that some CPU-driven visual effects in modern games are resolution sensitive, meaning there are edge cases where portions of the CPU workload can increase.
In terms of power efficiency, the Ryzen 7 7800X3D outperforms the Ryzen 9 7950X3D. Despite this, both chips displayed almost identical performance in our 1080p and 4K F1 2022 test results. You can see more detailed information about this in our gaming-specific data.
Office/Web
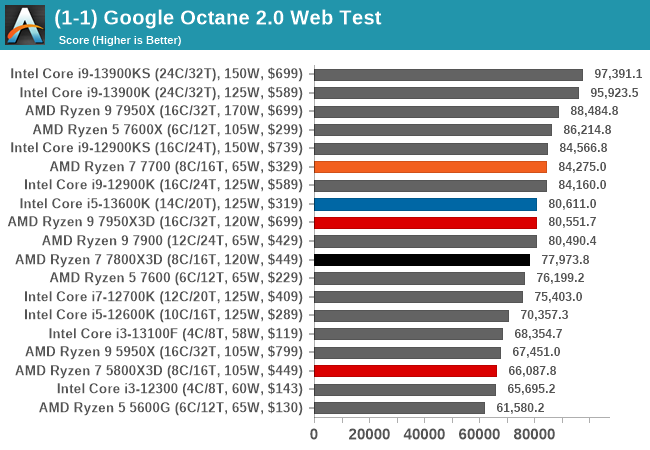
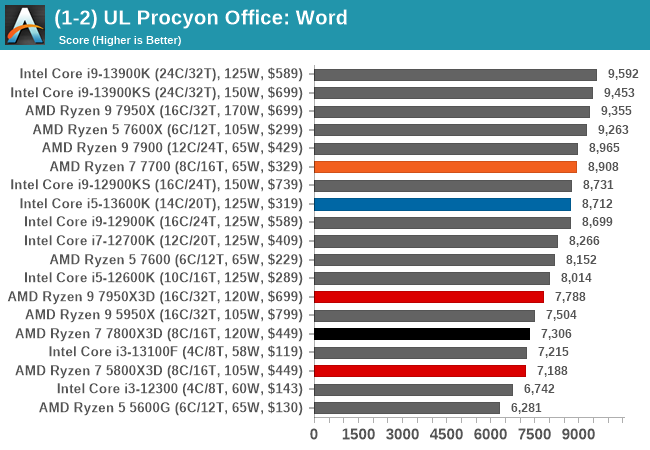
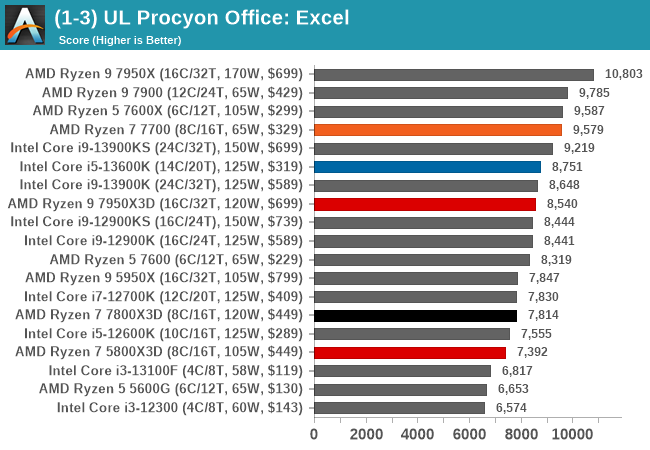
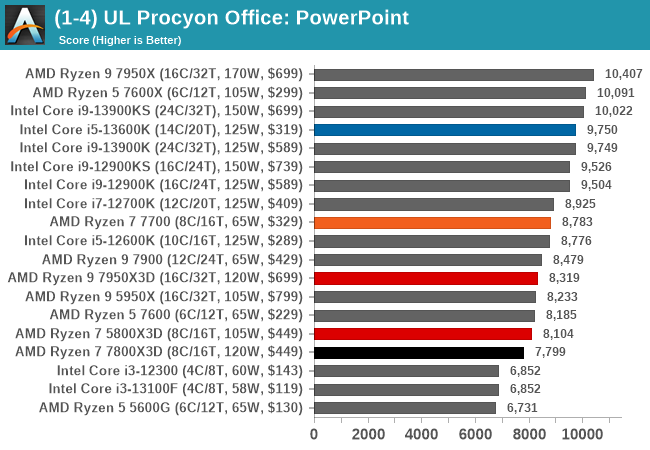
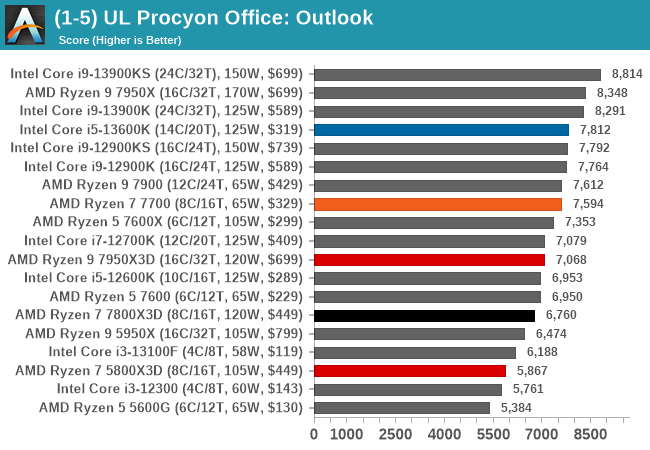
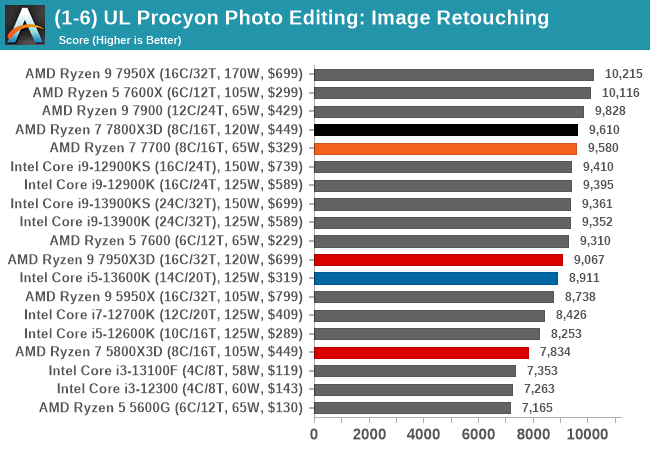
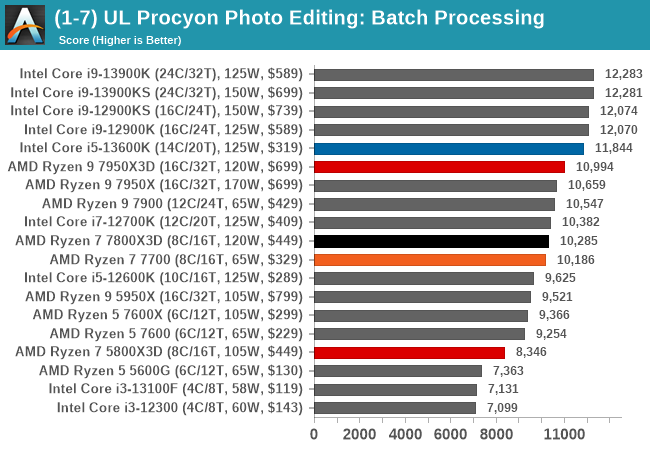
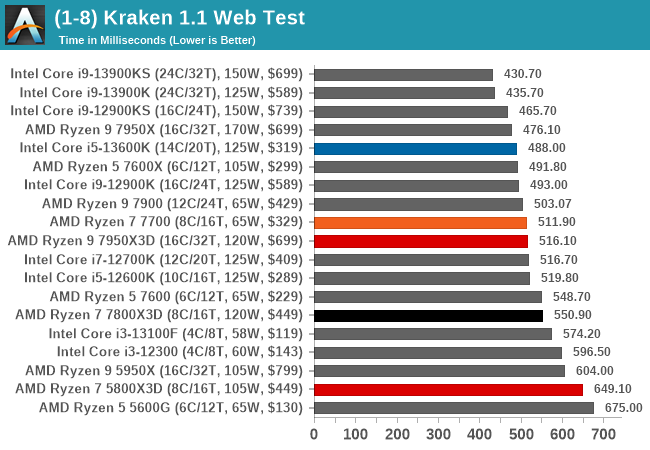
In the office and web-based section of our CPU suite, the Ryzen 7 7800X3D, we started to get similar vibes to how the Ryzen 7 5800X3D performed last year compared to the competition. In our UL Proycon Office benchmark, we didn't see the expected performance levels as the 8C/16T Ryzen 7 7700 outperformed the more expensive chip here. The Ryzen 7 7800X3D did perform better in the photo editing section of the UL Procyon suite, although it was only marginally better than the Ryzen 7 7700.


52 Comments
View All Comments
MetalScythe - Sunday, April 9, 2023 - link
It’s because Anandtech’s gaming benchmarks are using insanely outdated games.Do your due-diligence and read other publications’ reviews of the chip. They’re much faster at gaming than this “review” makes them seem.
meacupla - Wednesday, April 5, 2023 - link
Looking at the results in this review, are we certain that there was no "core parking driver" contamination? Because the 7800X3D seems really slow where it shouldn't be.Gamers Nexus had this issue and had to do a clean install to get their 7800X3D to work properly and not park cores.
Gavin Bonshor - Thursday, April 6, 2023 - link
Hi Meacupla, I can confirm I had no core parking driver issues, but I did use a fresh install of Windows 11 as per AMD's suggestion. I knew that issues could arise before even installing the CPU, but as I confirmed earlier, I didn't notice any odd behavior.Can I ask, where do you believe the 7800X3D is slow in our testing?
Foeketijn - Thursday, April 6, 2023 - link
The cases where it loses from the 5800X3D maybe.I find it also fascinating how often the 7600x is faster. And isn't mentioned when you make the "Cheaper CPU will enable you to buy a better GPU" point.
But that's a different story.
meacupla - Thursday, April 6, 2023 - link
this partAll the other reviews I've seen put the 7800X3D ahead by a wide margin in gaming results at 1080p and 1440p when compared against a 7600X and 7700X.
MetalScythe - Sunday, April 9, 2023 - link
Again, it’s because the games Anandtech uses for game reviews are incredibly outdated.I mean… GTA V in 2023!??
lopri - Wednesday, April 5, 2023 - link
People need to stop bitching about memory speed. 7000 series are hard-capped at 6000 MT/s (up to 6400 MT/s with questionable stability) and regular non-3D chips barely show the impact of faster memory. For these 3D V-cache chips, faster memory is literally a waste of money. As a matter of fact I'd argue it is one of the benefits of using these chips that you can get away with budget memory.roboiii - Thursday, April 27, 2023 - link
If you do a decent amount of reading/video watching it's fairly evident that 6000 @ 30 is the "sweet spot". I think rather than "bitching" people want to see their tech sources engage in actual tech that's applicable to the part in question. x3d is a part designed & marketed to gamers, who typically have a rig with high end parts and utilize the highest memory settings to achieve better performance.tjrneal - Thursday, April 6, 2023 - link
The borked 7950x3d results are still there for Dwarf Fortress and Factorio.Gavin Bonshor - Thursday, April 6, 2023 - link
They are because they are the figures we got when running the original test suite. I did run the suite a couple of times to see where the PPM driver got things wrong, and the 7950X3D running on the 3D V-Cache enabled CCD performs as well as the 7800X3D does in Factorio and Dwarf Fortress.