OCZ Vertex 3 Pro Preview: The First SF-2500 SSD
by Anand Lal Shimpi on February 17, 2011 3:01 AM ESTThe Test
Note that I've pulled out our older results for the Kingston V+100. There were a couple of tests that had unusually high performance which I now believe was due the drive being run with a newer OS/software image than the rest of the older drives. I will be rerunning those benchmarks in the coming week.
I should also note that this is beta hardware running beta firmware. While the beta nature of the drive isn't really visible in any of our tests, I did attempt to use the Vertex 3 Pro as the primary drive in my 15-inch MacBook Pro on my trip to MWC. I did so with hopes of exposing any errors and bugs quicker than normal, and indeed I did. Under OS X on the MBP with a full image of tons of data/apps, the drive is basically unusable. I get super long read and write latency. I've already informed OCZ of the problem and I'd expect a solution before we get to final firmware. Often times actually using these drives is the only way to unmask issues like this.
| CPU |
Intel Core i7 965 running at 3.2GHz (Turbo & EIST Disabled) Intel Core i7 2600K running at 3.4GHz (Turbo & EIST Disabled) - for AT SB 2011 |
| Motherboard: |
Intel DX58SO (Intel X58) Intel H67 Motherboard |
| Chipset: |
Intel X58 + Marvell SATA 6Gbps PCIe Intel H67 |
| Chipset Drivers: |
Intel 9.1.1.1015 + Intel IMSM 8.9 Intel 9.1.1.1015 + Intel RST 10.2 |
| Memory: | Qimonda DDR3-1333 4 x 1GB (7-7-7-20) |
| Video Card: | eVGA GeForce GTX 285 |
| Video Drivers: | NVIDIA ForceWare 190.38 64-bit |
| Desktop Resolution: | 1920 x 1200 |
| OS: | Windows 7 x64 |
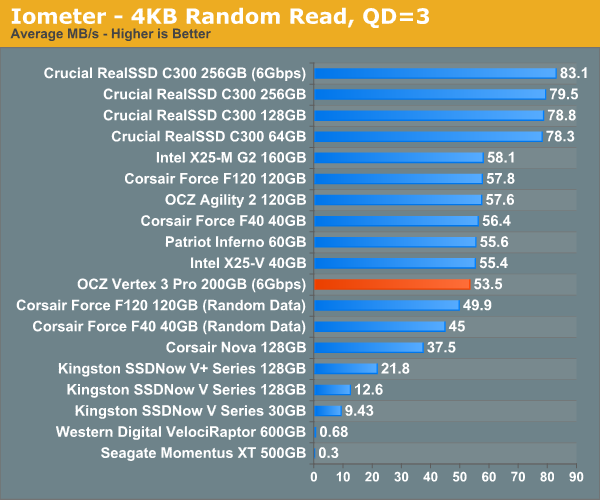
Random Read/Write Speed
The four corners of SSD performance are as follows: random read, random write, sequential read and sequential write speed. Random accesses are generally small in size, while sequential accesses tend to be larger and thus we have the four Iometer tests we use in all of our reviews.
Our first test writes 4KB in a completely random pattern over an 8GB space of the drive to simulate the sort of random access that you'd see on an OS drive (even this is more stressful than a normal desktop user would see). I perform three concurrent IOs and run the test for 3 minutes. The results reported are in average MB/s over the entire time. We use both standard pseudo randomly generated data for each write as well as fully random data to show you both the maximum and minimum performance offered by SandForce based drives in these tests. The average performance of SF drives will likely be somewhere in between the two values for each drive you see in the graphs. For an understanding of why this matters, read our original SandForce article.
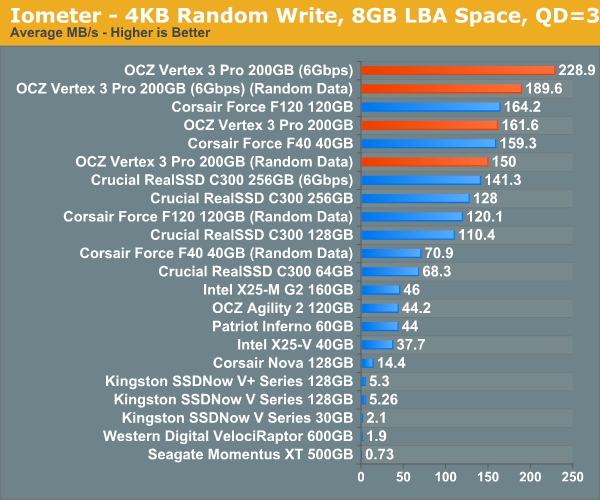
Random write performance is much better on the SF-2500, not that it was bad to begin with on the SF-1200. In fact, the closest competitor is the SF-1200, the rest don't stand a chance.
Many of you have asked for random write performance at higher queue depths. What I have below is our 4KB random write test performed at a queue depth of 32 instead of 3. While the vast majority of desktop usage models experience queue depths of 0 - 5, higher depths are possible in heavy I/O (and multi-user) workloads:
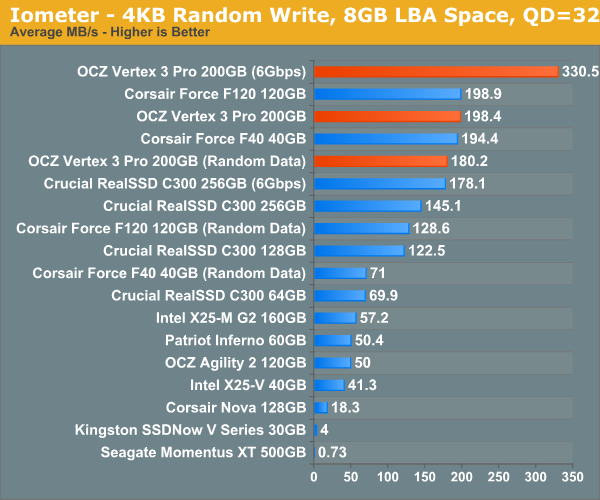
Ramp up the queue depth and there's still tons of performance on the table. At 3Gbps the performance of the Vertex 3 Pro is actually no different than the SF-1200 based Corsair Force, the SF-2500 is made for 6Gbps controllers.


144 Comments
View All Comments
Aitam - Monday, February 21, 2011 - link
I know it would bring the load to the CPU rather than the controller, but I wonder if using it on other drives could bring similar results in terms of increased speed or reduced writing overhead...bhougha10 - Wednesday, February 23, 2011 - link
Ok, Anand, enough is enough. I know you know when the G3 is going to be here. Please spill it. Do I want to wait any longer, or is it futile?MarcHFR - Thursday, February 24, 2011 - link
Dear all, Dear Anand,I think it's important to note that AnandTech Storage Bench, like PC Mark Vantage HDD, represent a "best case" for SandForce based SSD.
These benchmarks are based on logs which have recorded accesses to be repeated, but not the data contained in these accesses. These means that the data used in the benchmark may well be highly compressible, which isn’t necessarily the case in real usage.
Hrel - Saturday, March 12, 2011 - link
500 bucks for a 100GB drive?! Are you FUCKING KIDDING ME?!that's LITERALLY 10 times more expensive than it's worth...
I simply do not understand this; who besides Bill Gates and Warren Buffet would buy this crap? No I take that back, both those guys are smart enough to turn down such an offensive value proposition. So I repeat, WHO WOULD BUY THIS?!