The Intel Core i7-8086K Review
by Ian Cutress on June 11, 2018 8:00 AM EST- Posted in
- CPUs
- Intel
- Core i7
- Anniversary
- Coffee Lake
- i7-8086K
- 5 GHz
- 8086K
- 5.0 GHz
Ambient Overclocking and Power Scaling Analysis
For 24/7 overclocking, we used our hotel-room system to get a good shot at how the Core i7-8086K performs on a closed loop liquid cooler going through the multipliers one-by-one. For this we used a variation of our standard overclocking technique.
Home Overclocking, Step by Step
Due to timing and location, our overclocking method was as follows.
- Start with the CPU at 40x Multiplier and 1.05 volts
- Set Load Line Calibration to Level 1 (ASRock Z370 Taichi)
- Load up OS
- Run our Blender Test, take power and temperature data from AIDA
- If system fails, or test is over 95C, then stop testing
- If system fails, add +0.025 volts and go to step 3
- If test passes, note down Blender result, add a multiplier, and go back to step 3
Blender was a good mix of hardcore CPU load, memory accesses, and as a result, power draw. Any issues that required additional voltage for stability and coherency were found relatively quickly after starting the test.
The Blender test lasts around five minutes on the Core i7-8086K, which for our quick overclock testing is sufficient. For users who insist on 24/7 rock solid stability, it isn’t the test that you might like to see, however it still marks a good attack on the system.
Results
Using this methodology, we achieved the following results:

At default, our system would hit an all-core turbo of 4.3 GHz and scored 311 seconds on Blender, with the CPU at 62 degrees C and consuming 115 W. We also tested the system ‘at auto’ but with the CPU set to 5.0 GHz on all cores. This gave a Blender score of 268 seconds, but much higher temperatures (82 C) and power consumption (175 W).
When going up from 4.0 GHz manually, we can see that there is a disconnect in how the power is reported in the OS: AIDA64 reported a voltage that slowly increased as the multiplier increased, even if the voltage setting in the BIOS did not change. It also showed to hit a wall at 1.364 volts, even when adjusting the voltage in the BIOS helped with the higher multipliers. This was odd, but I think the poignant results here are Blender, Temperature, and Power.
I’m going to adjust the Blender results in to ‘renders per hour’, which is easier to visualize in a graph.
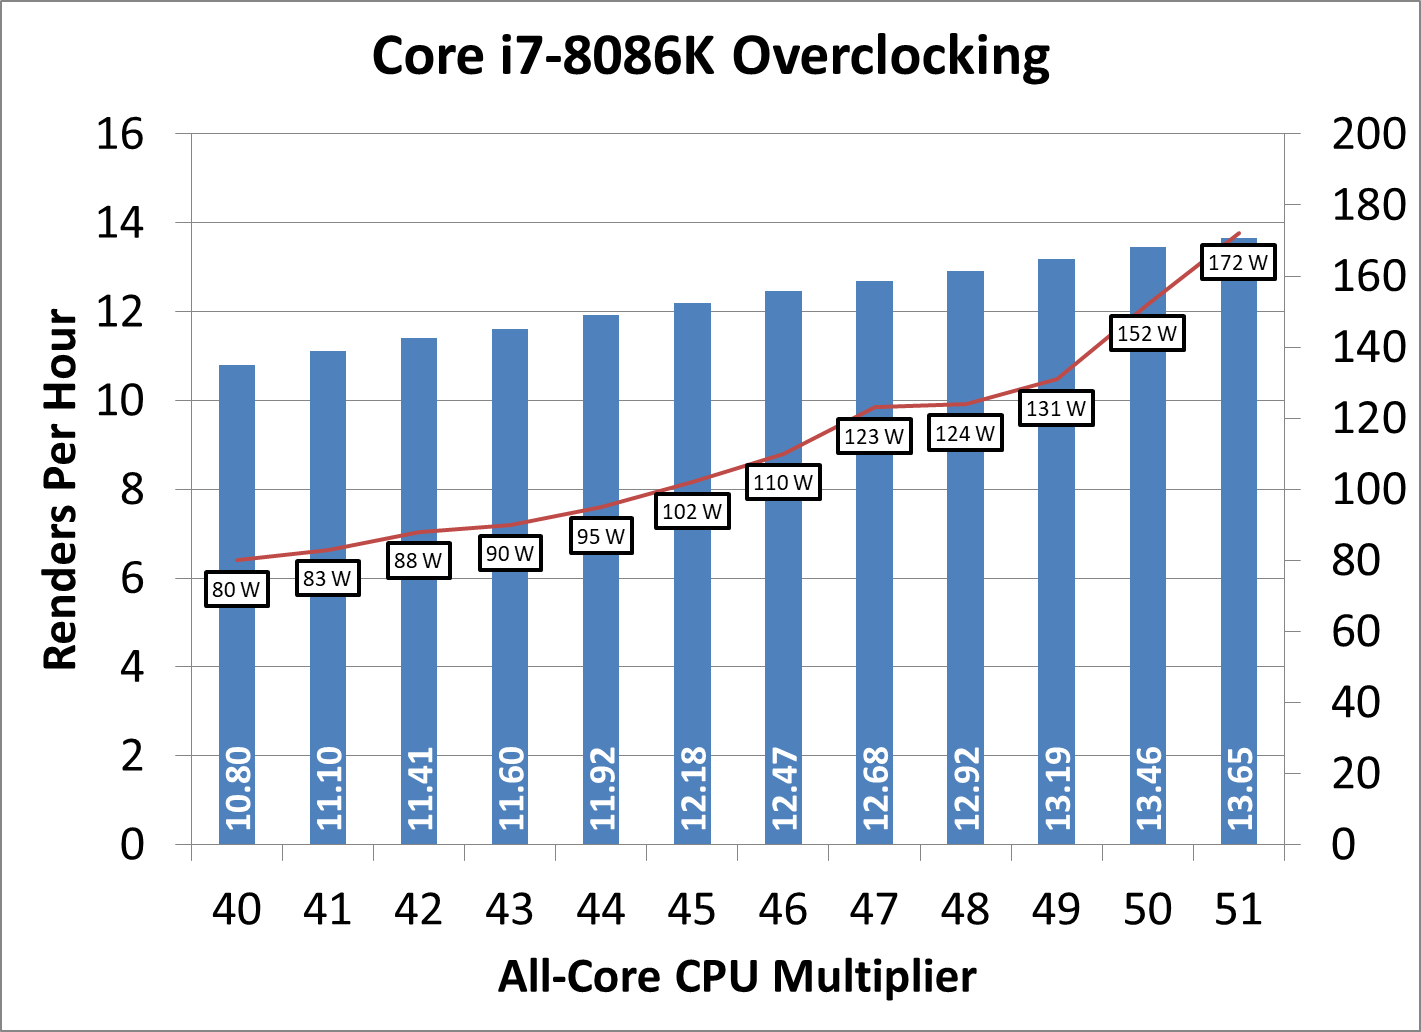
The key result here is going to be 5.0 GHz, which is a nice medium for power and performance but also temperatures and voltage. At this level, the system gives +16% performance for an additional +16% frequency. The problem though is the power.
Comparing a 5.0 GHz manual overclock to the ‘stock’ operation of the processor shows a 32% increase in power. But when compared to an equivalent 4.3 GHz manual overclock, the power gain is now a whopping +68%. We really are stretching the microarchitectural design at this stage.
What should be noted is that at default, the system drew 115W, which is 20W above TDP. As mentioned before, TDP is defined at base frequency, which is in this case 4.0 GHz. We saw a power consumption of 80 W at the base frequency, showing that the processor is still technically under that TDP value, at least when the user optimizes the voltage. At a 95W level, if we were maximizing frequency for the TDP, we should have seen a base frequency of 4.4 GHz with this chip.
However, consider what might have been if Intel had decided to increase the TDP by +10W or +15W, up to 110W. In that case, we could have been playing with a chip that had a base frequency of around 4.6 GHz, depending on how other chips perform. As we will see in the results over the next few pages, Intel really did miss a trick here by not going down an increased TDP route.
Going for Gold
For anyone interested about the upper limits of our chip, 5.1 GHz was the realistic maximum. I could not get 5.2 GHz to be stable with Blender for more than about 30 seconds without it throwing an error, and as the voltage in the BIOS rose up to 1.425 volts, the system was showing peak temperatures at 100C, well beyond a comfortable limit. Speaking with Alva and his nice chip, he stated that with a delid, 5.2 GHz should be possible, although beyond that might be a bit tough given how quickly the voltage seems to ramp in our sample.
As for absolute maximum that we could load into Windows with, I was able to see 5.4 GHz. No load was applied for fear of the temperatures, and 5.5 GHz did not want to play ball.
Testing at 5.0 GHz
As part of our testing, we were able to run through a few benchmarks at both a high overclock and fast memory (and we tried both). Again, many thanks to ASRock again for the system for the system loan.


111 Comments
View All Comments
peevee - Monday, June 11, 2018 - link
8086 being slower than 8700 just indicates an error in your methodology.For example, one has updated microcode for exploits and another does not.
TheinsanegamerN - Monday, June 18, 2018 - link
OOORrrrr....its a different motherboard, not the usual test bed. The motherboard used for this is an asrock board, which explains the difference in performance.Memo.Ray - Monday, June 11, 2018 - link
As I mentioned in my comment in the other article a couple of days ago:Intel managed to give away 8086 "binned" 8700K (AKA 8086K) and still make some money on top of it. win-win situation :D
https://www.anandtech.com/comments/12940/intels-co...
Xenphor - Monday, June 11, 2018 - link
How did they get such a lower score on the Dolphin benchmark with a 5ghz overclock on the 8086k? Isn't the benchmark single core only and considering the 8086 already turbos to 5ghz on a single core, why would there be that much of a difference? I tried it on my 8700k at 5ghz and only get a score of about 265-270 with 2666mhz ram.Ian Cutress - Monday, June 11, 2018 - link
The 5.0 GHz turbo, at stock, doesn't kick in that often. Depends on how the software sets its own affinity, and most do not. This is the danger with only single core turbo - with all the modern software in the background, even with Windows and scheduling, you rarely hit single core Turbo.Xenphor - Monday, June 11, 2018 - link
I suppose but even on the Dolphin forums spreadsheet the highest score is a 249 which is a 7700k at 5.2ghz.Ian Cutress - Tuesday, June 12, 2018 - link
I'll retest when I'm back home at the end of the week and recovered from jet lagXenphor - Tuesday, June 12, 2018 - link
Well don't feel like you have to. Just thought it was weird.Vatharian - Monday, June 11, 2018 - link
7 years ago, first batches of Core i7-2600K (like mine) were able to reach stable 5.0-5.2 GHz on water, on all 4 cores. Given 7 years difference and 32 vs 14 nm, I am maybe not disappointed (there are +2 cores, half a CPU more), but rather not amused. IPC is higher, that's one, DDR4 can reach 3 times higher frequencies than DDR3, that's two, so there are improvements, but given the bovine excrement that goes on chipset side and PCI-Express connectivity it's clear to see the stagnation.SanX - Monday, June 11, 2018 - link
Total flop. The processor in your phone is probably more hi-tech, has more transistors, more cores, and was made on more advances factories with 10nm litho being all sold below $25.